The Williams Institute
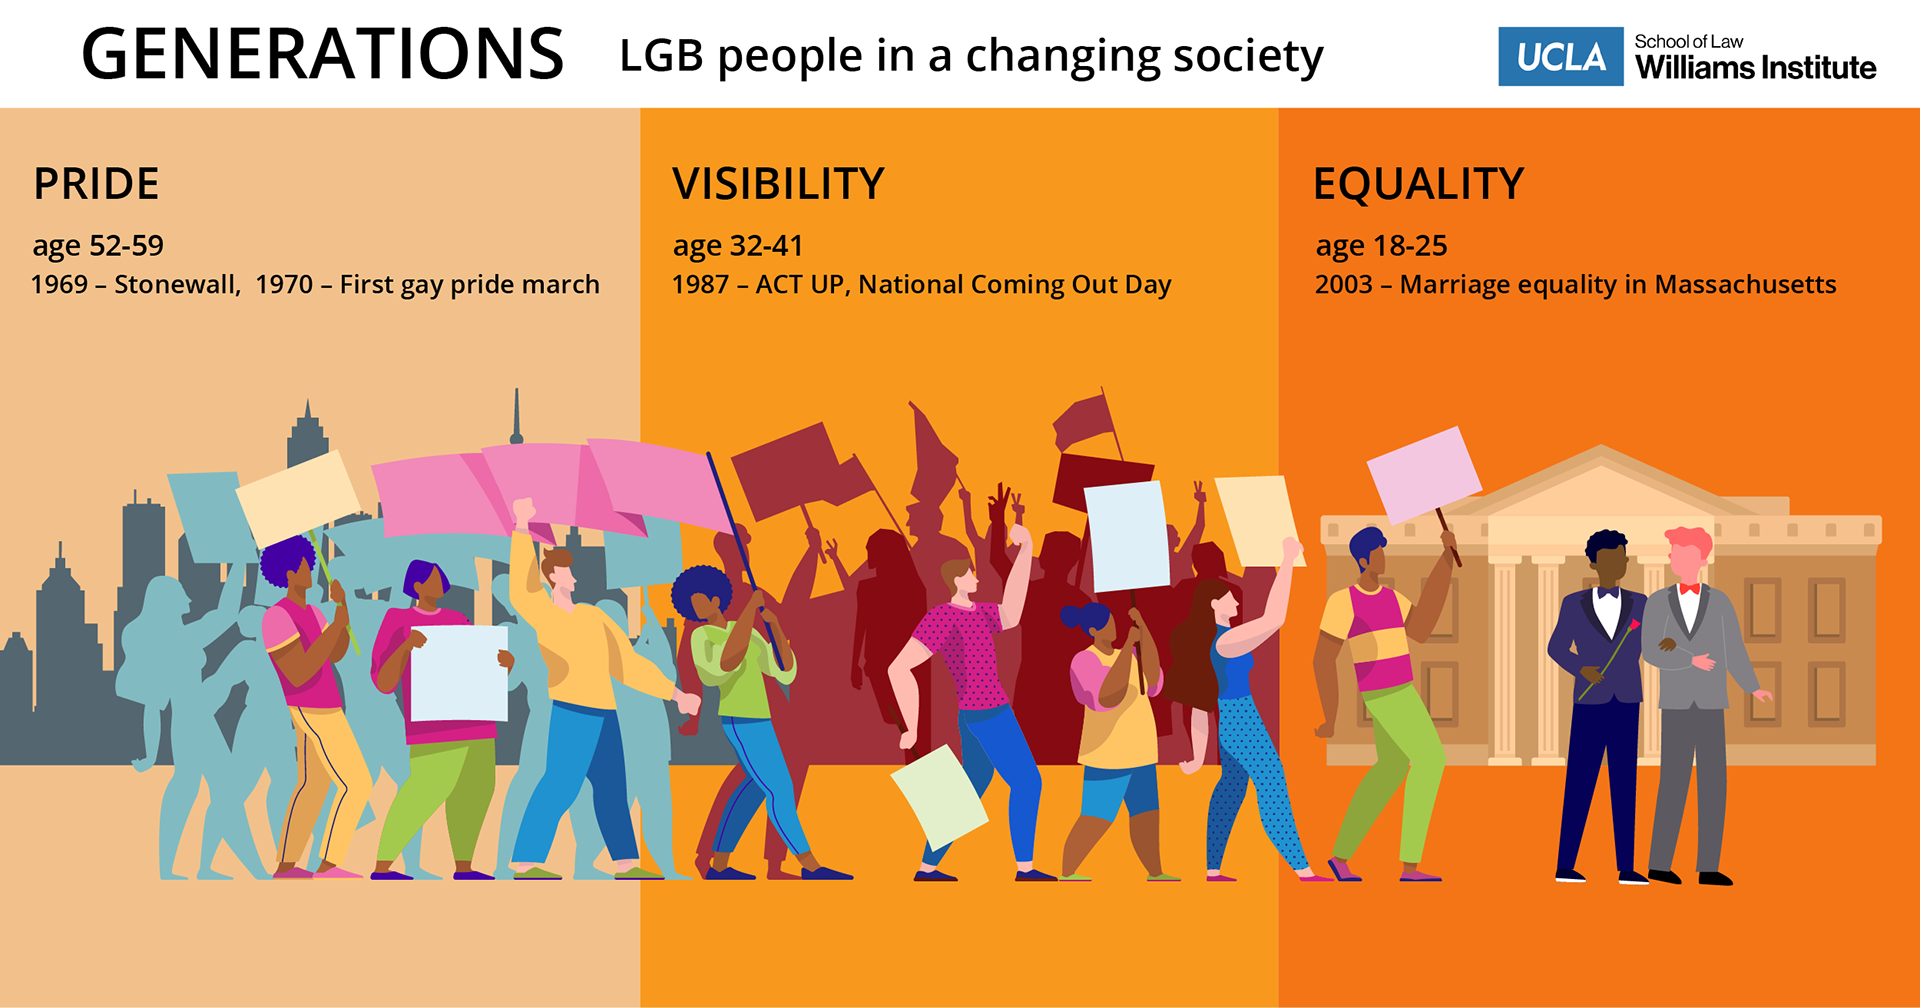
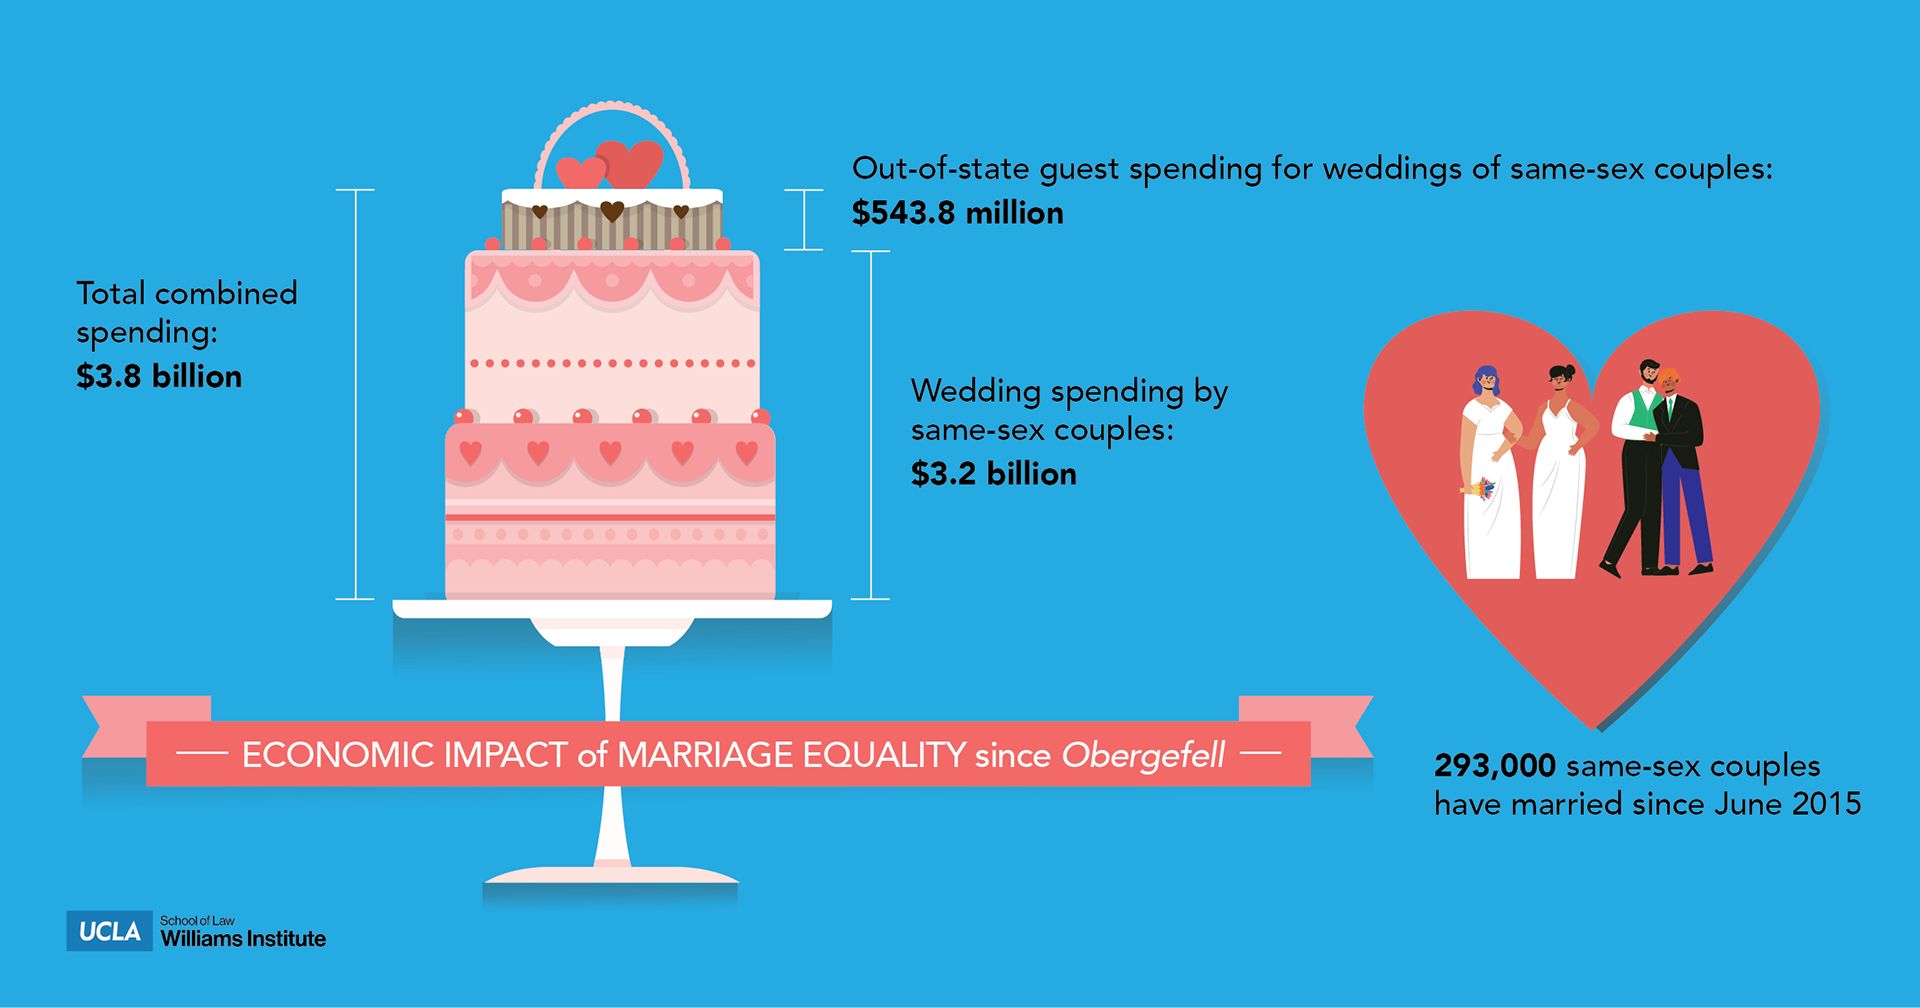
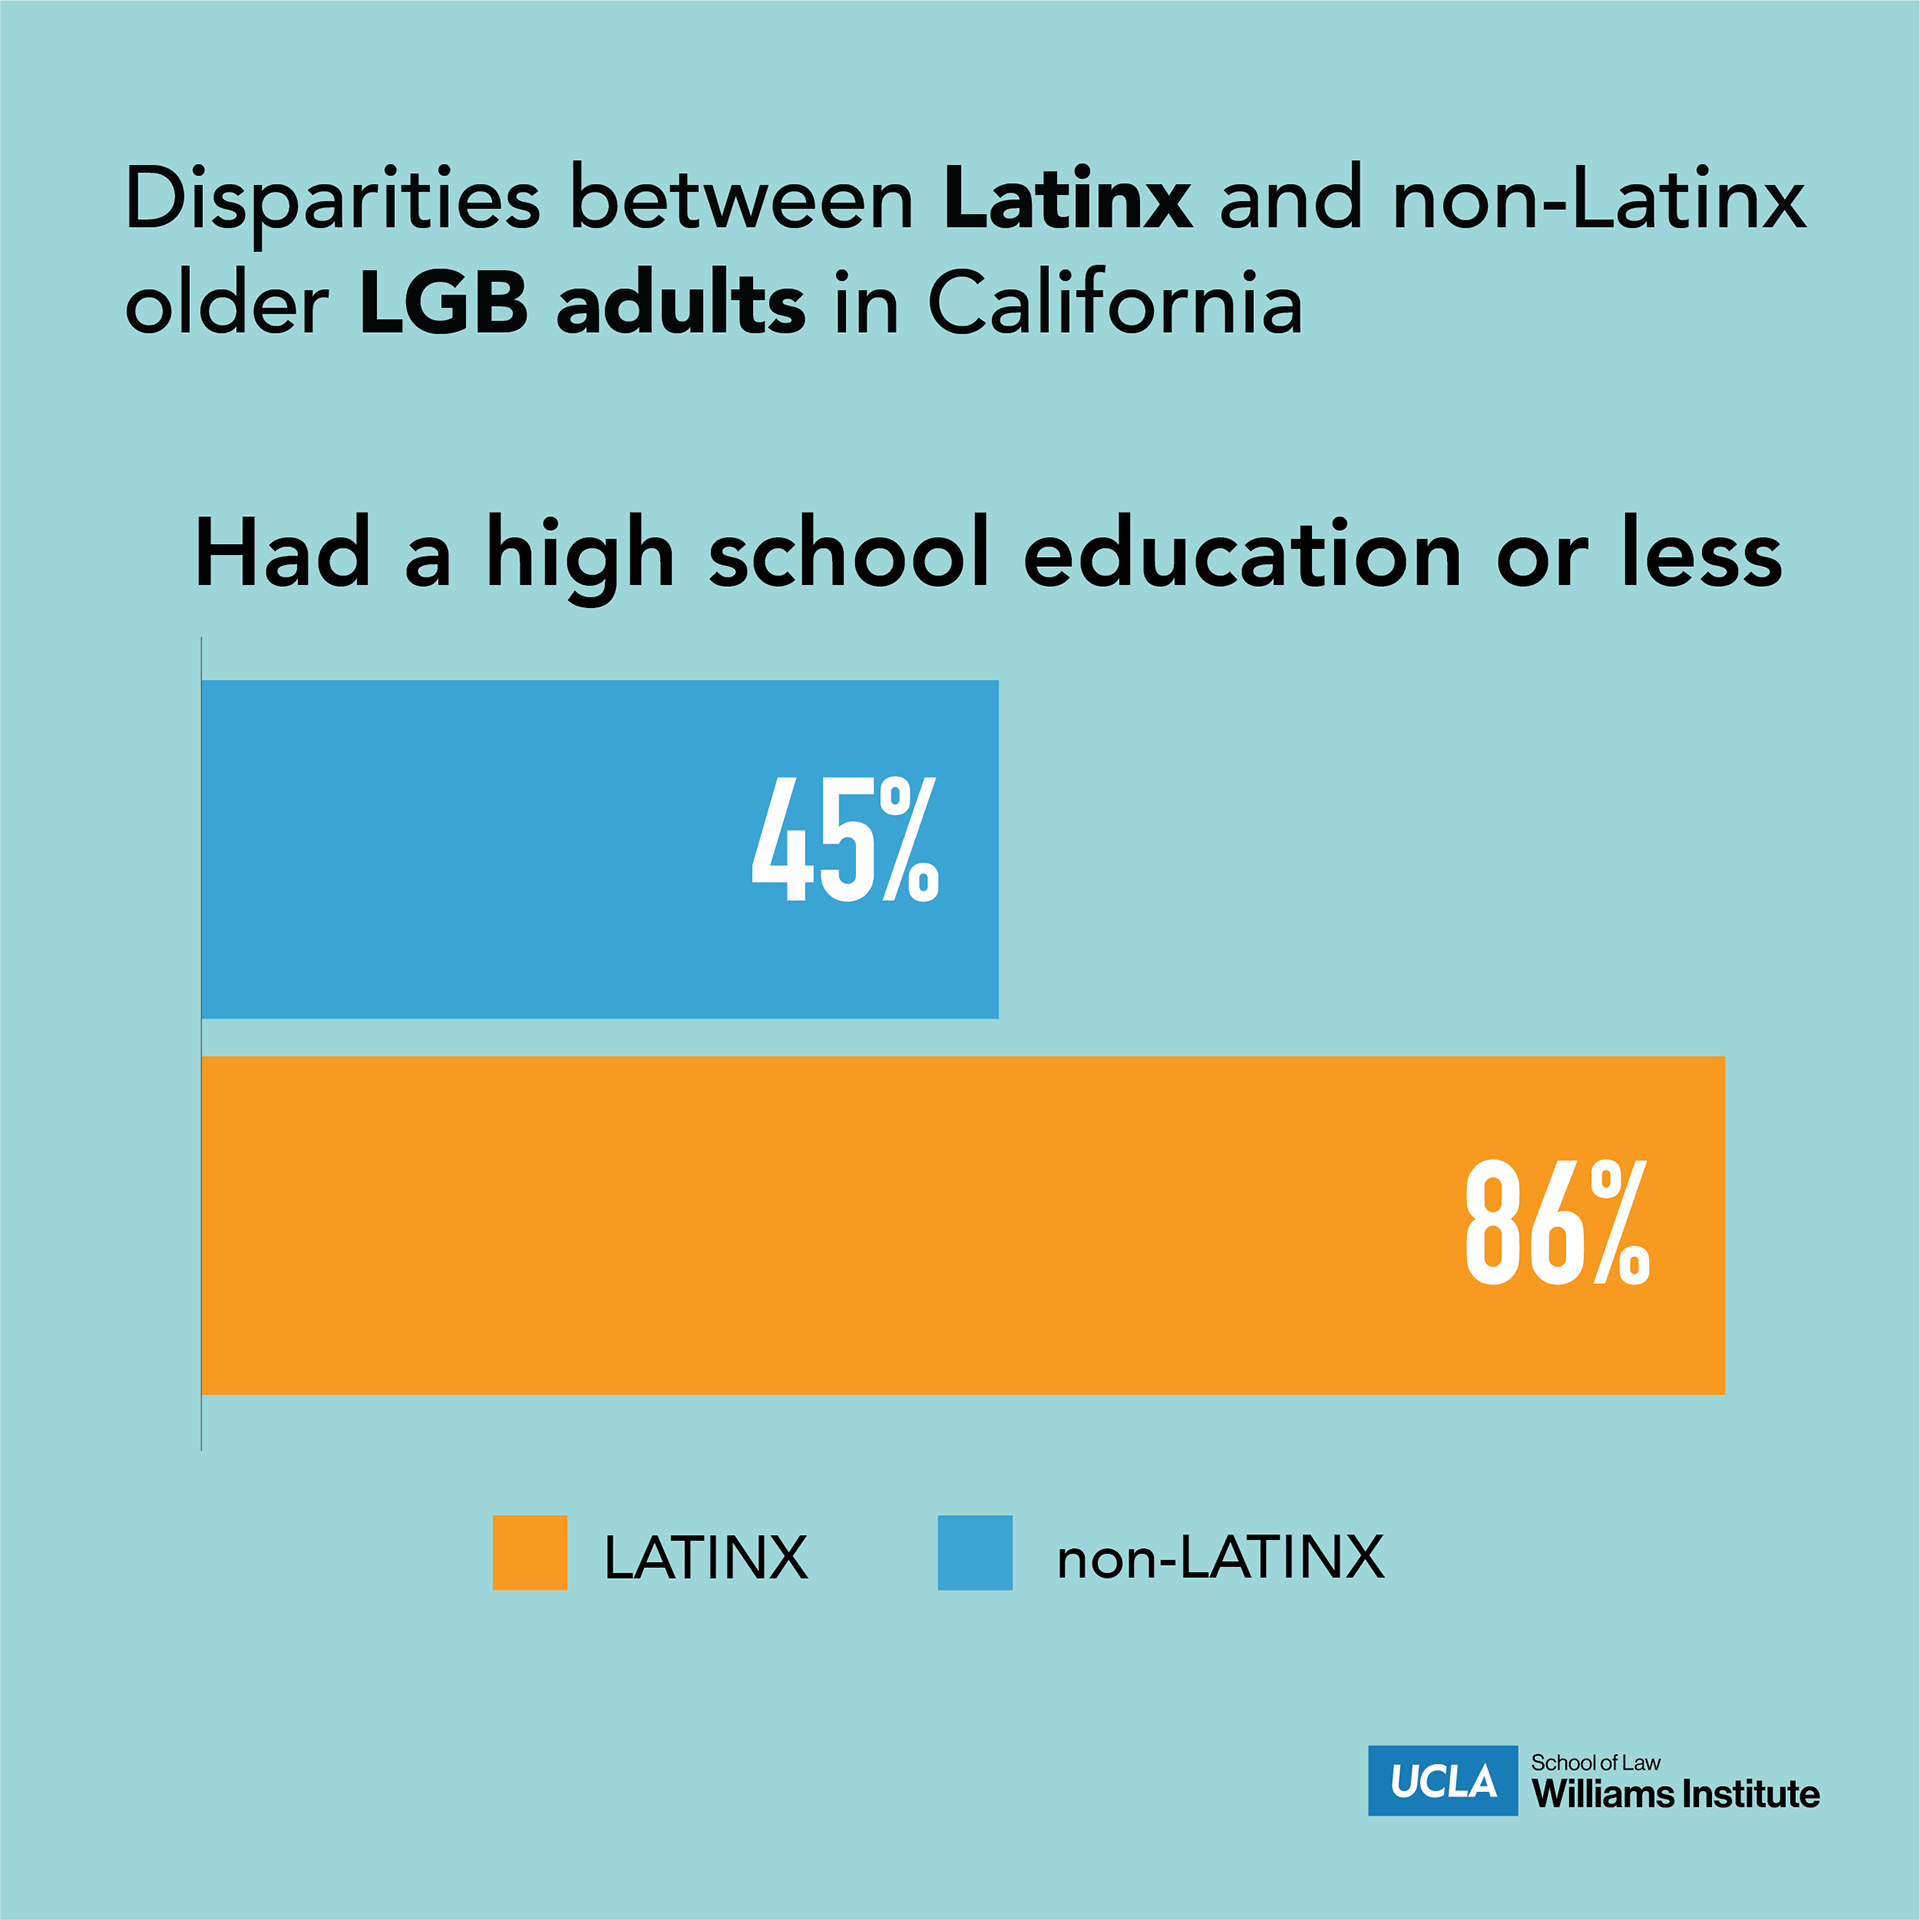
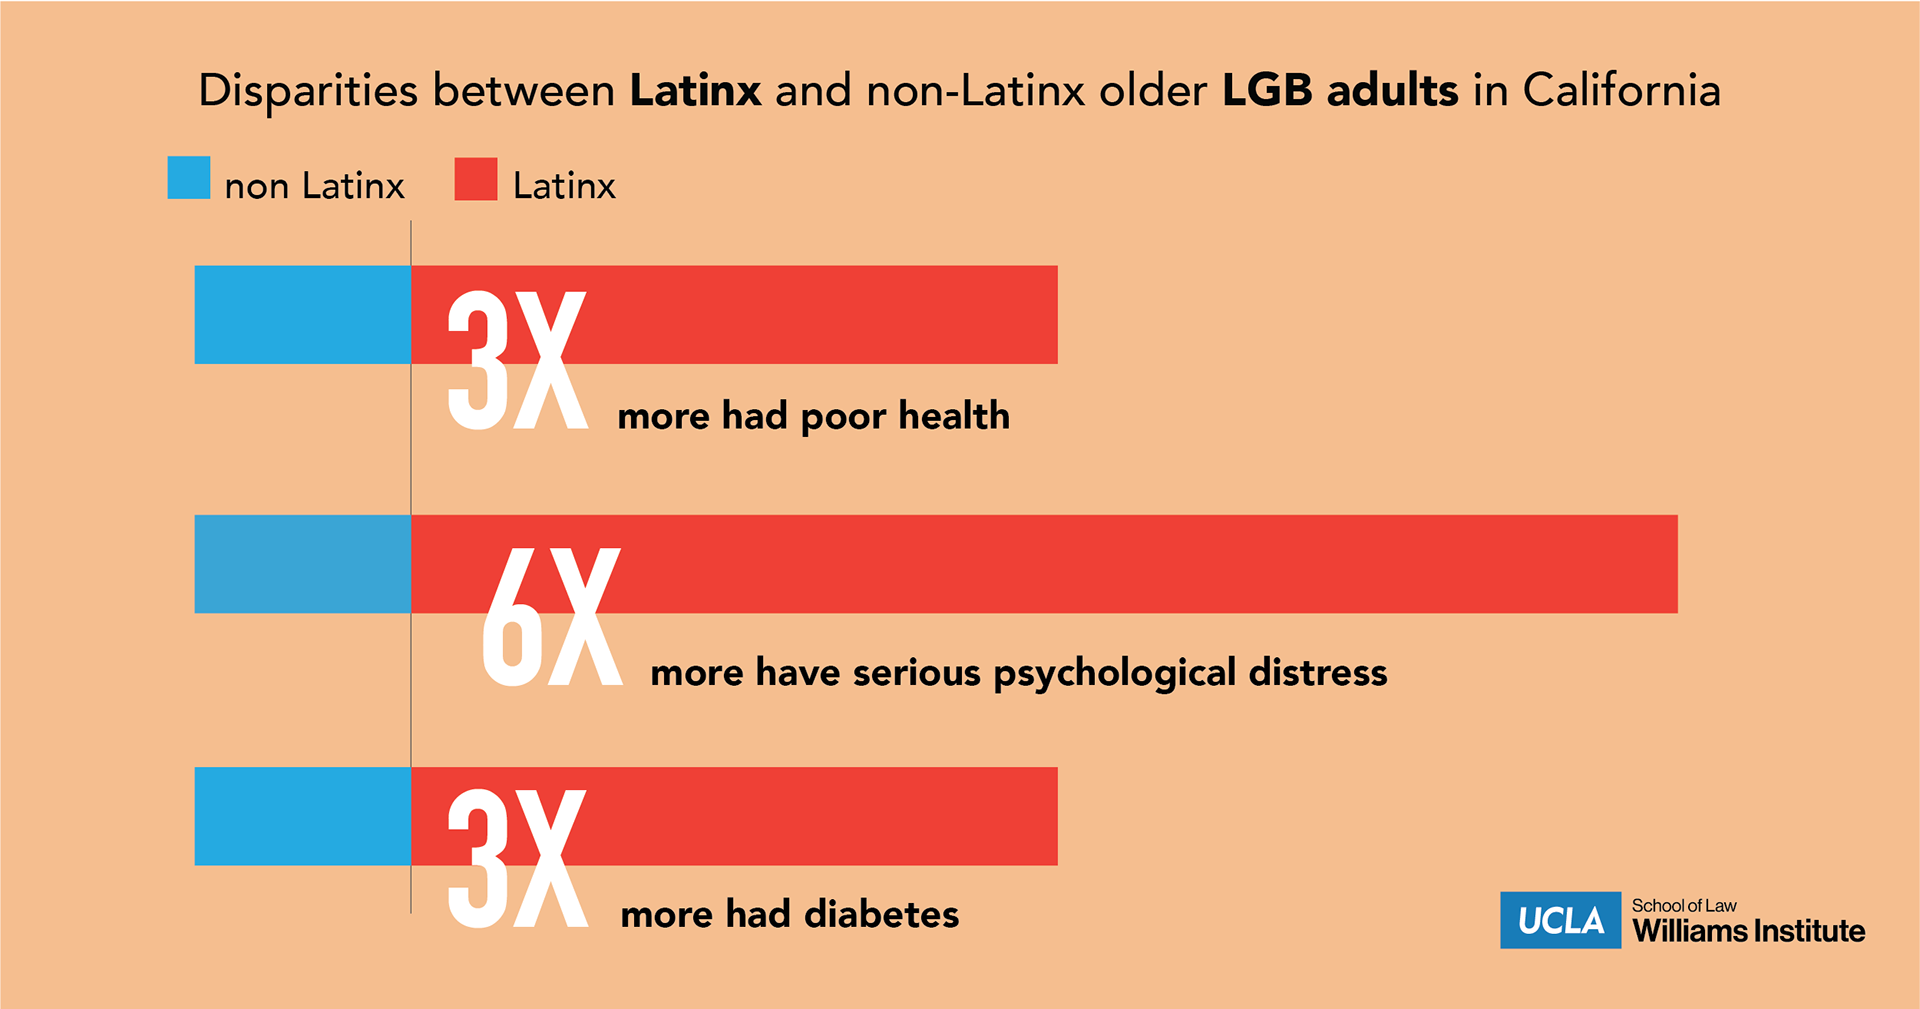
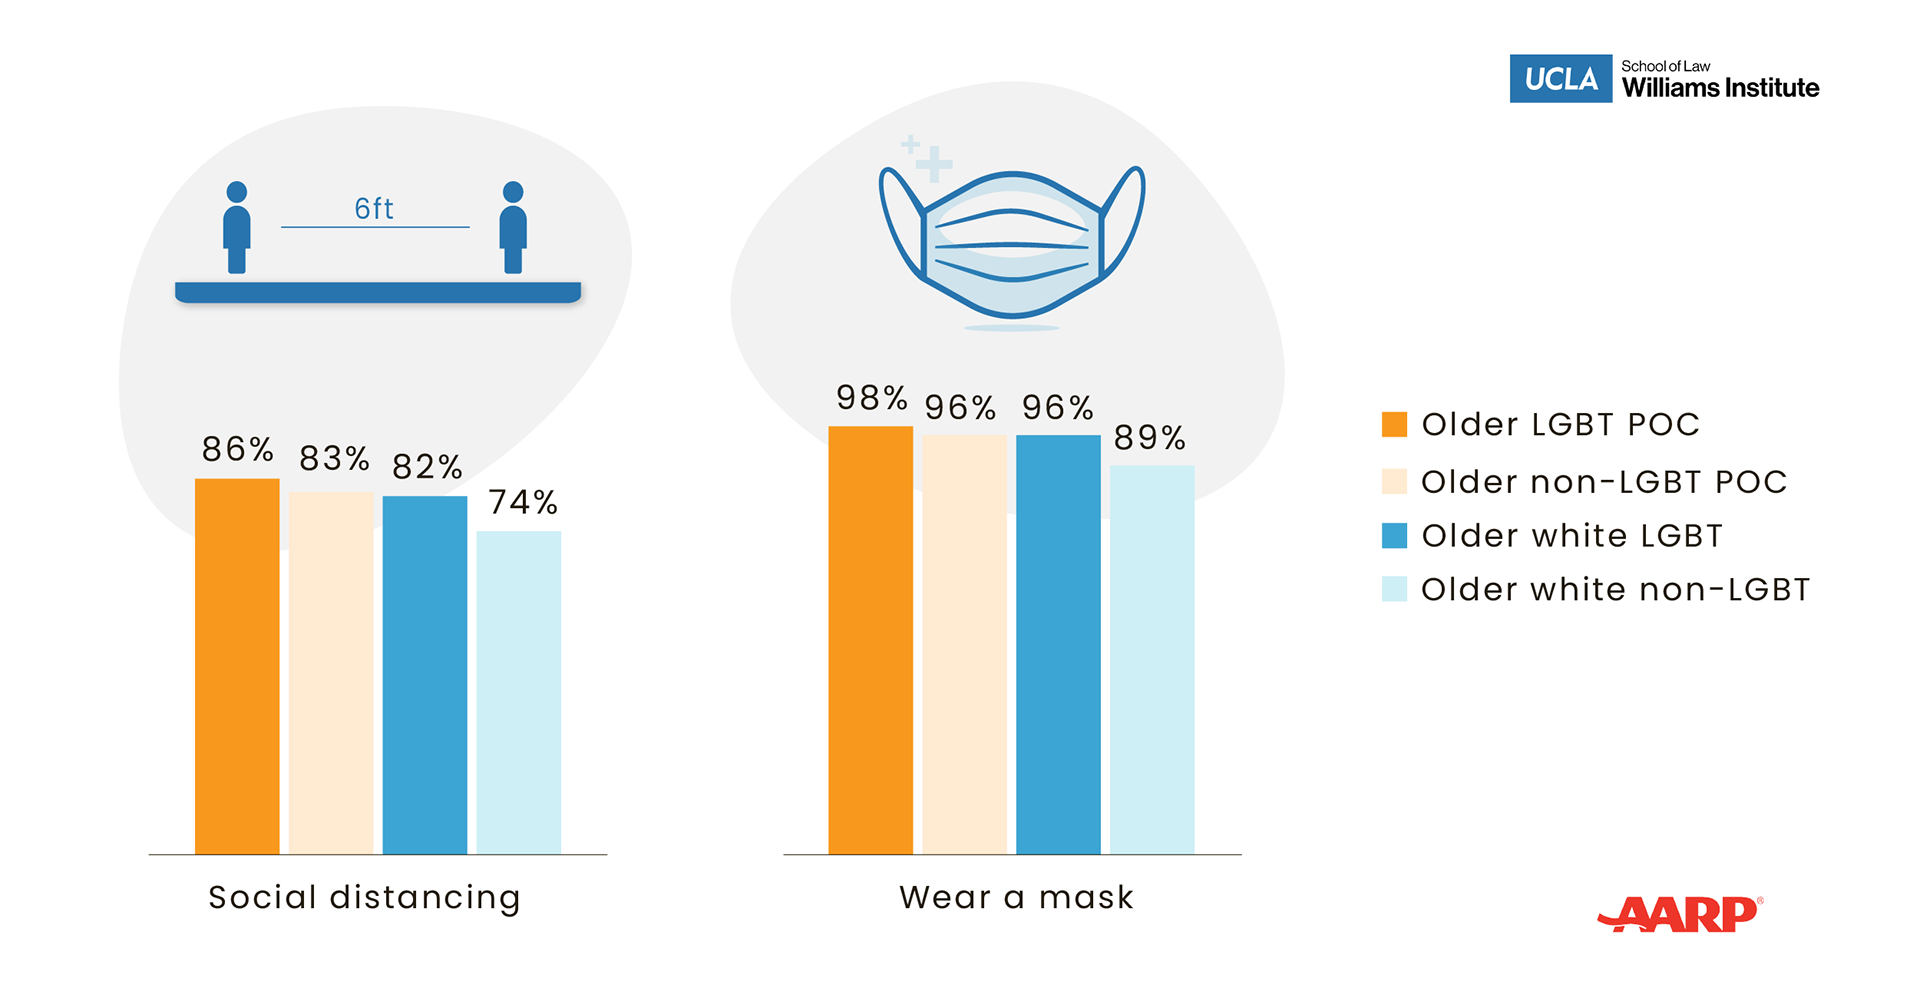
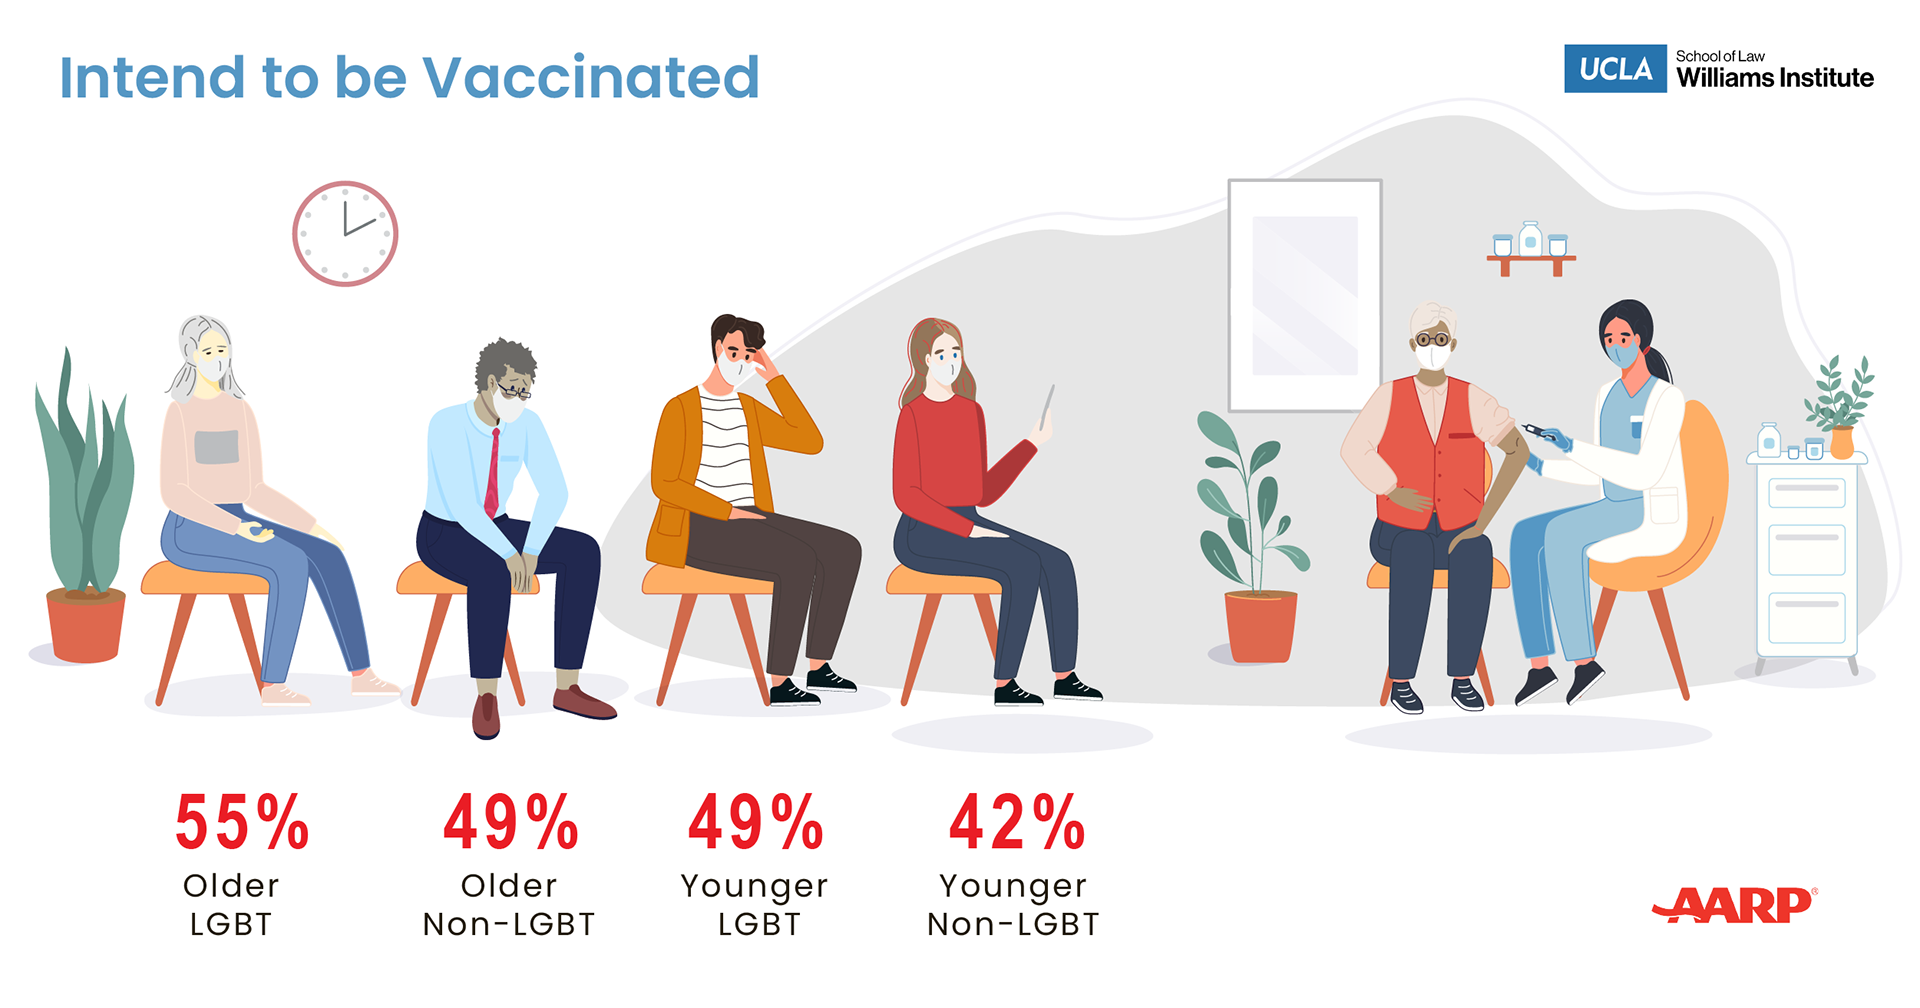
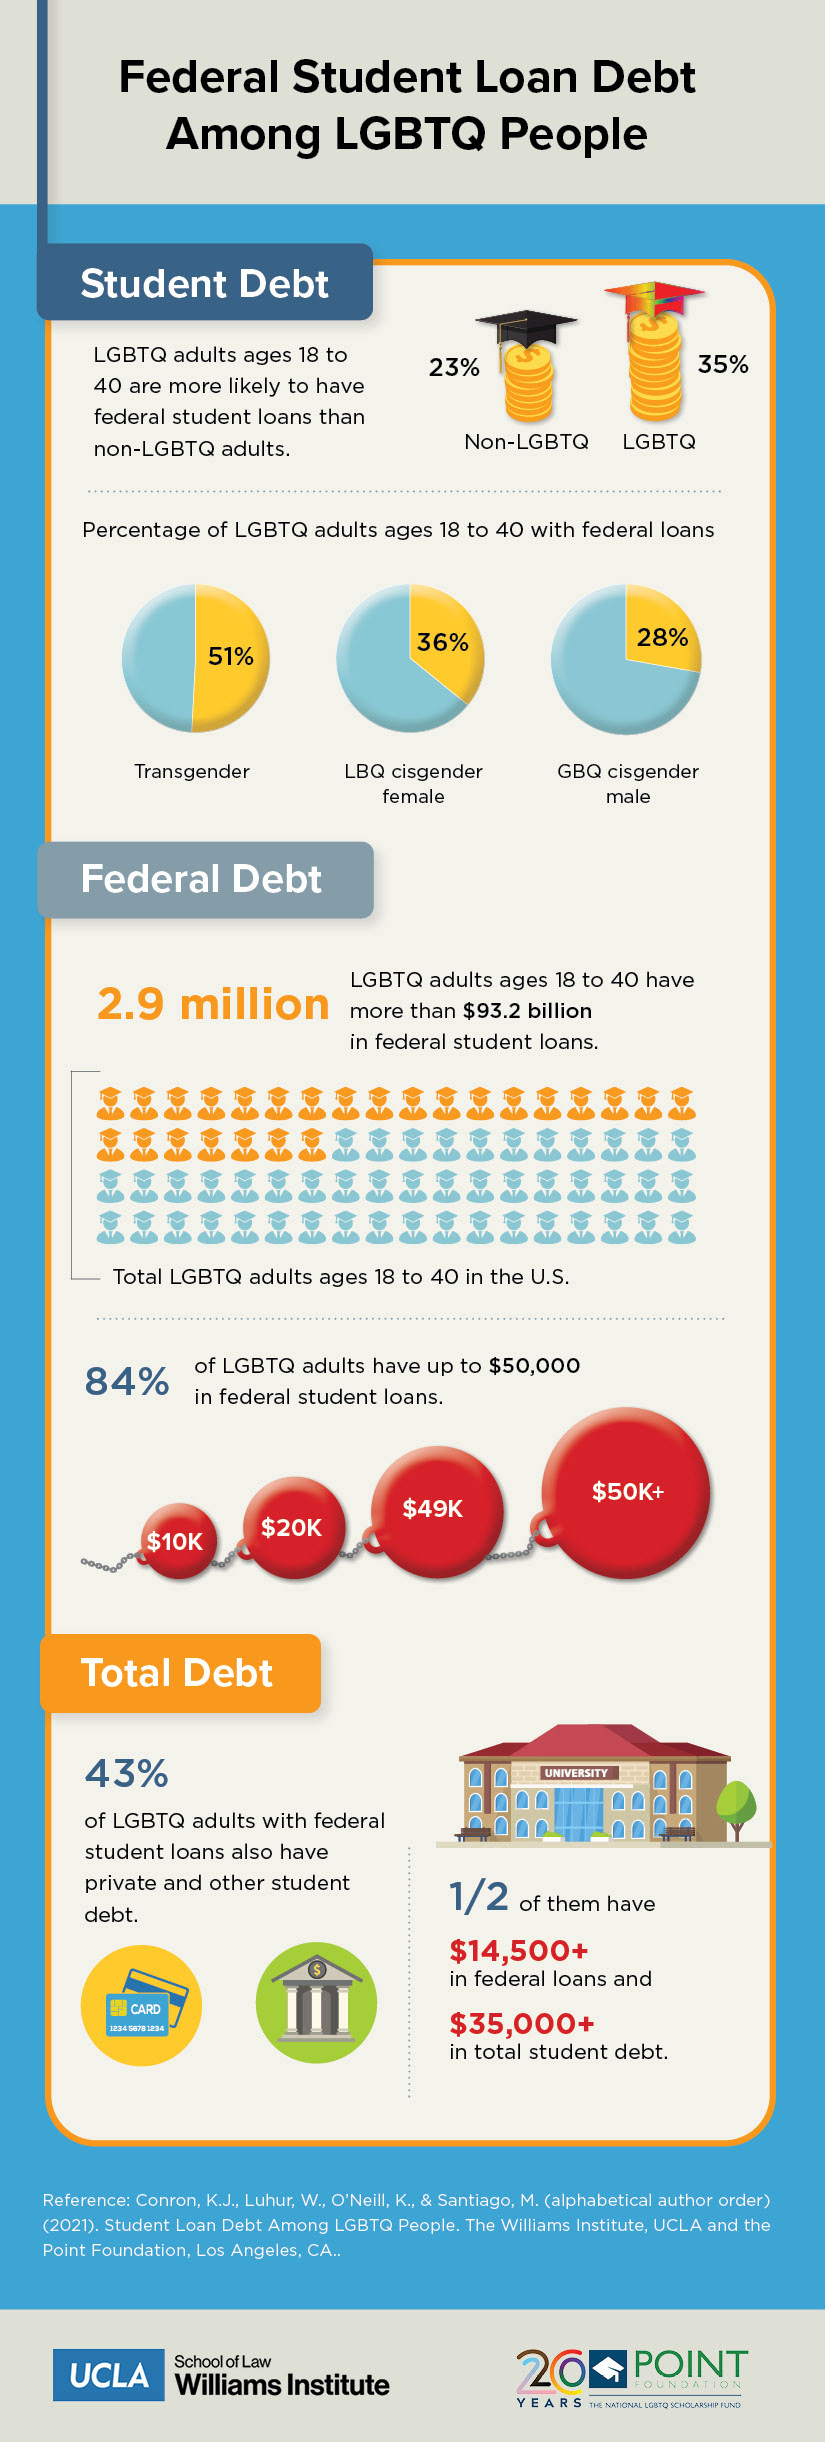
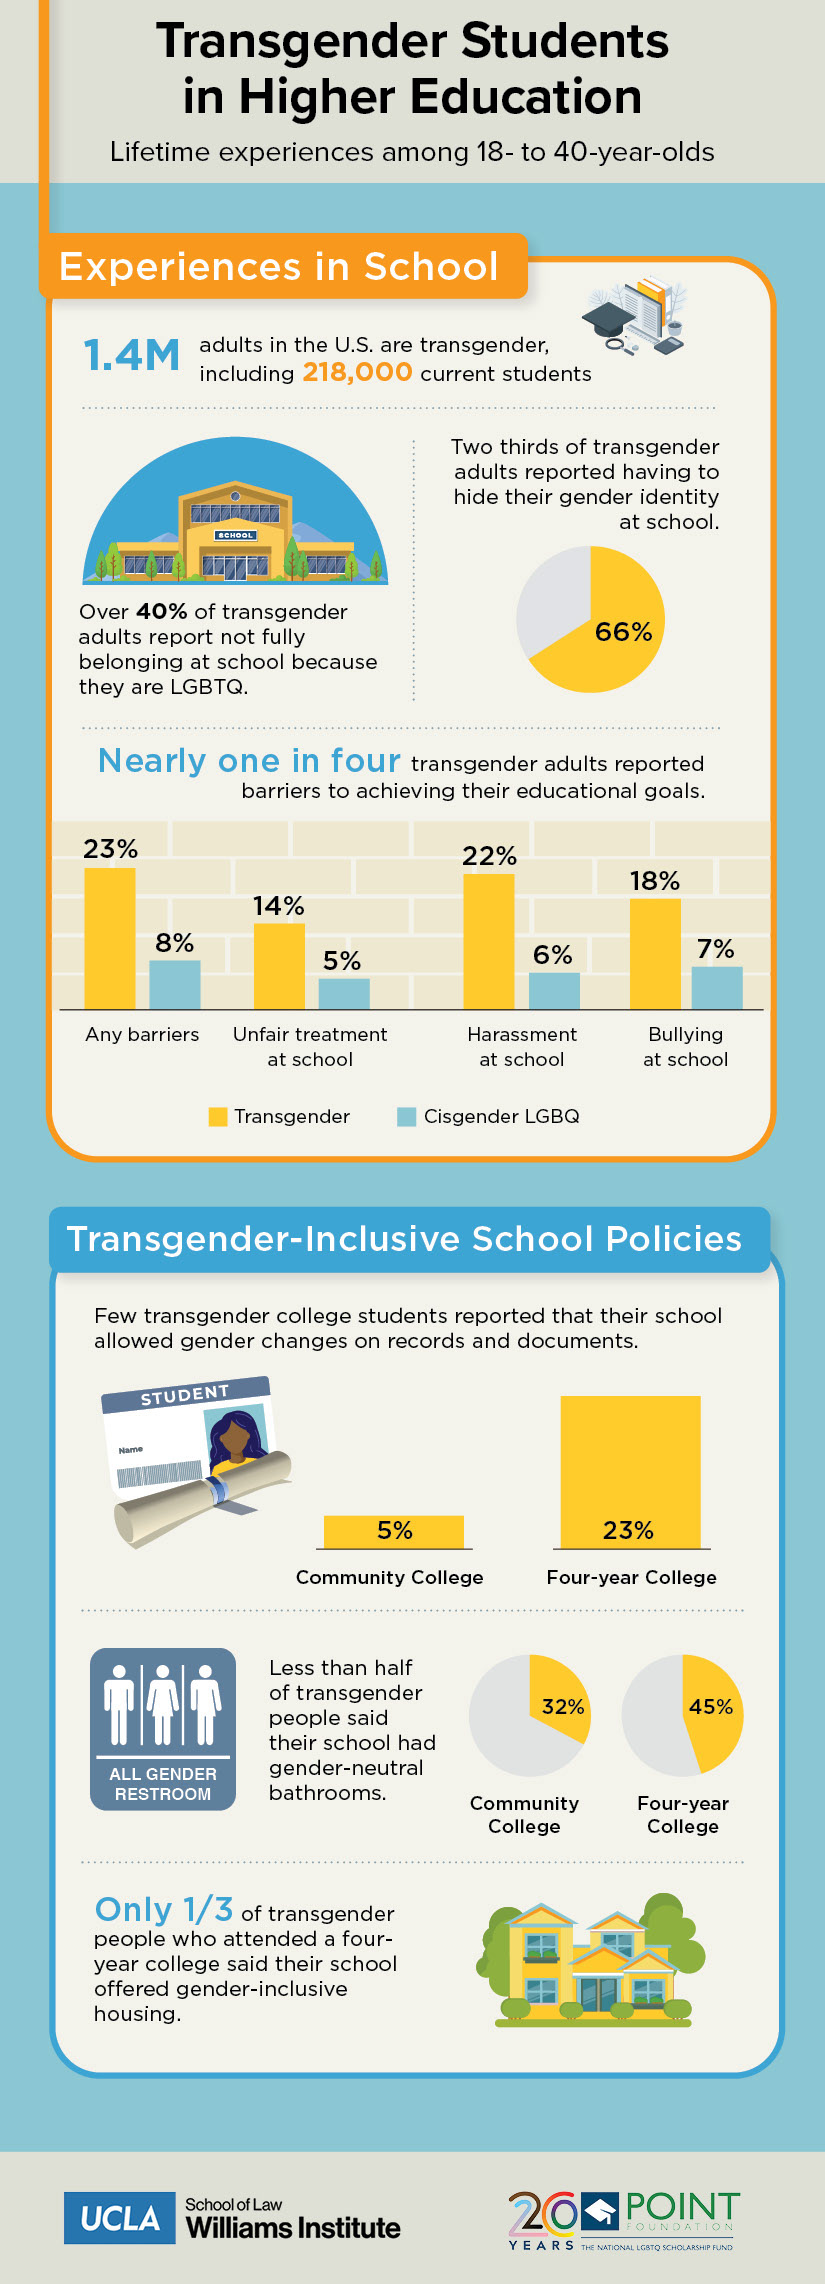
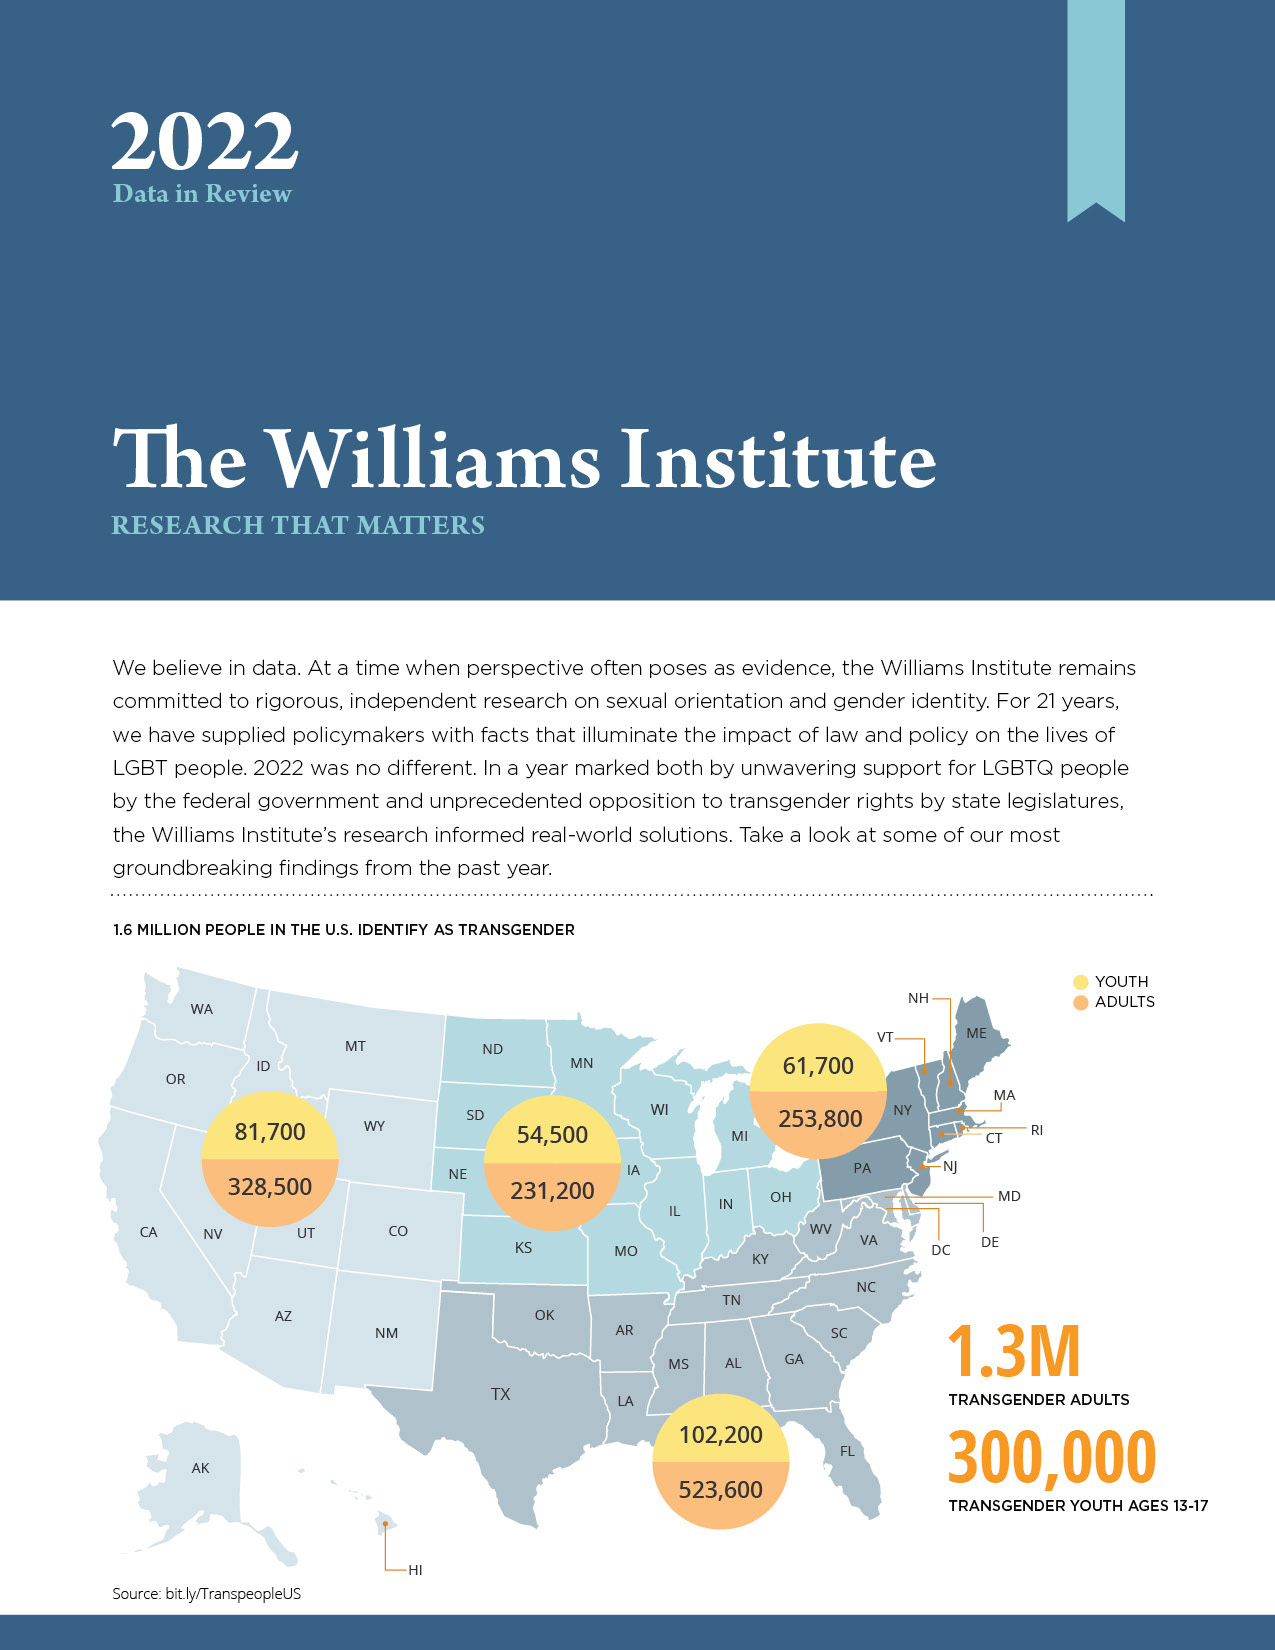
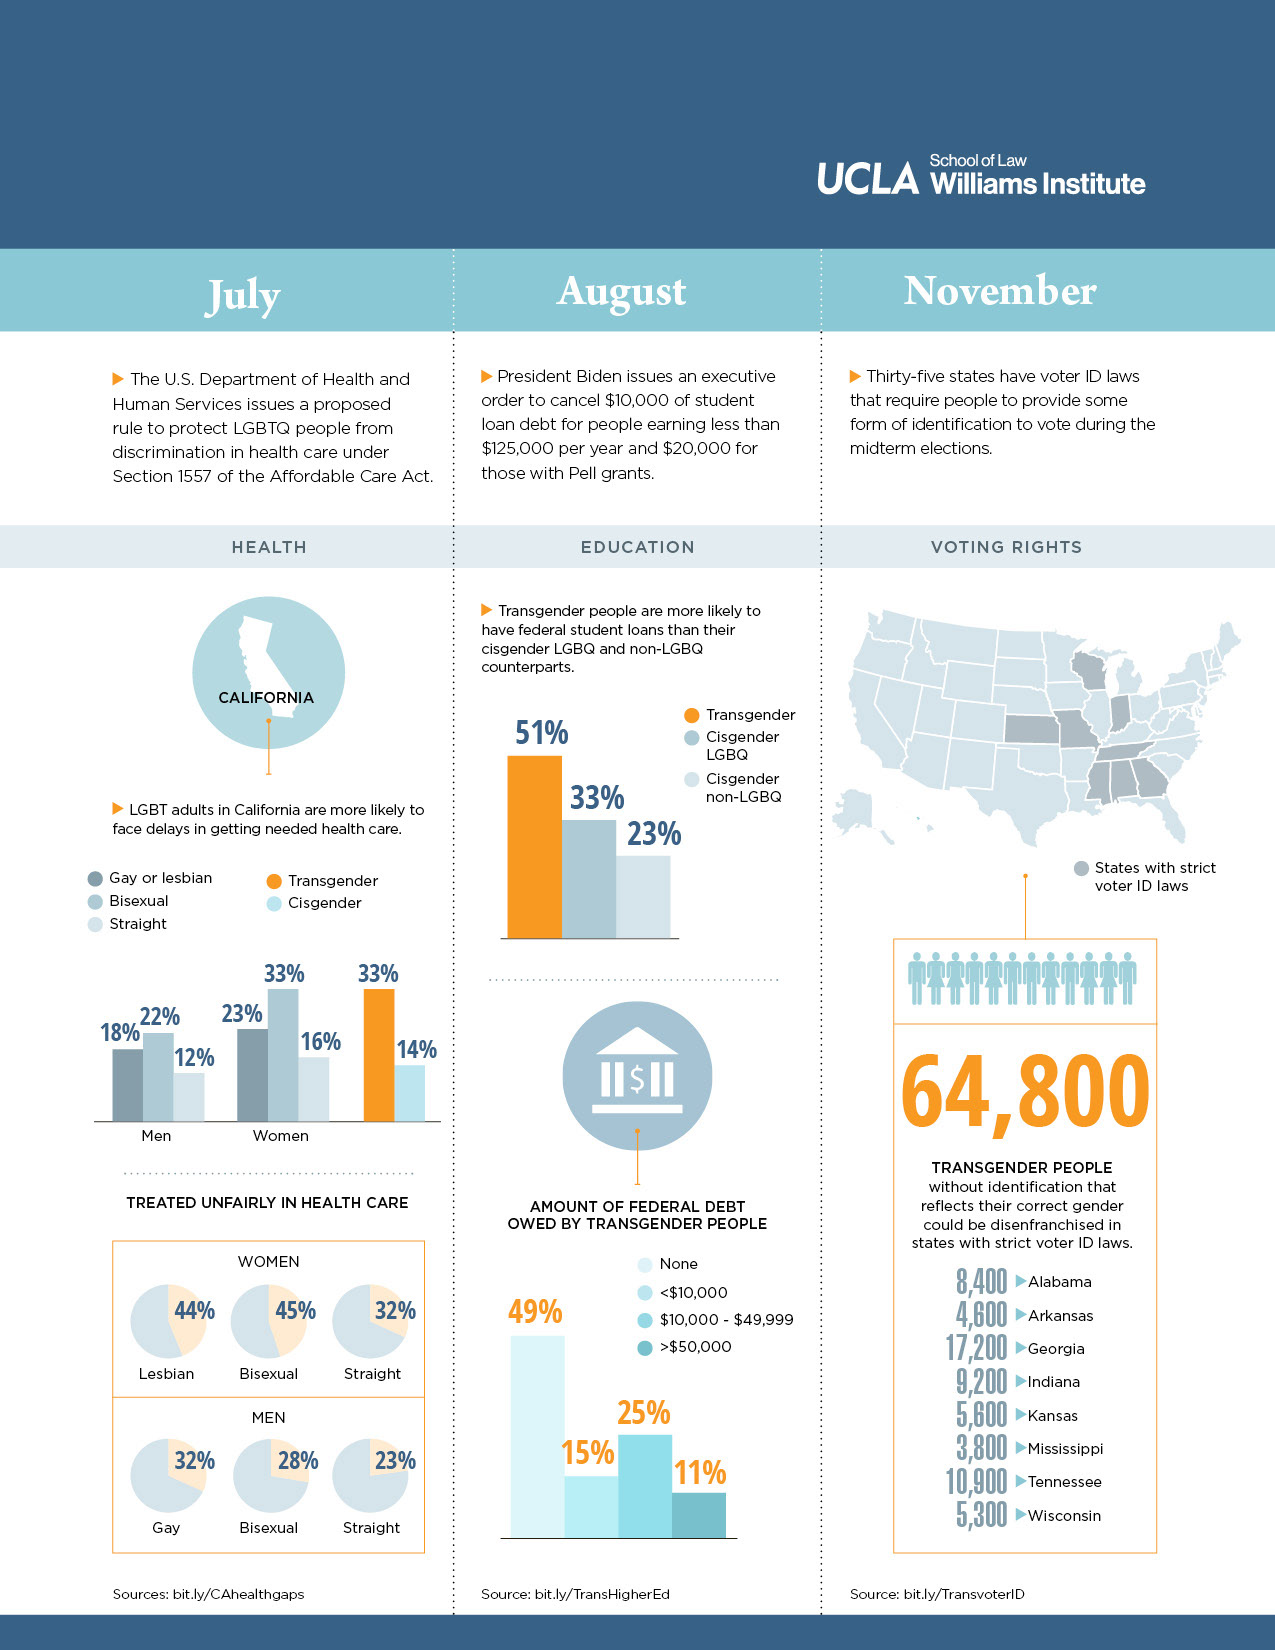
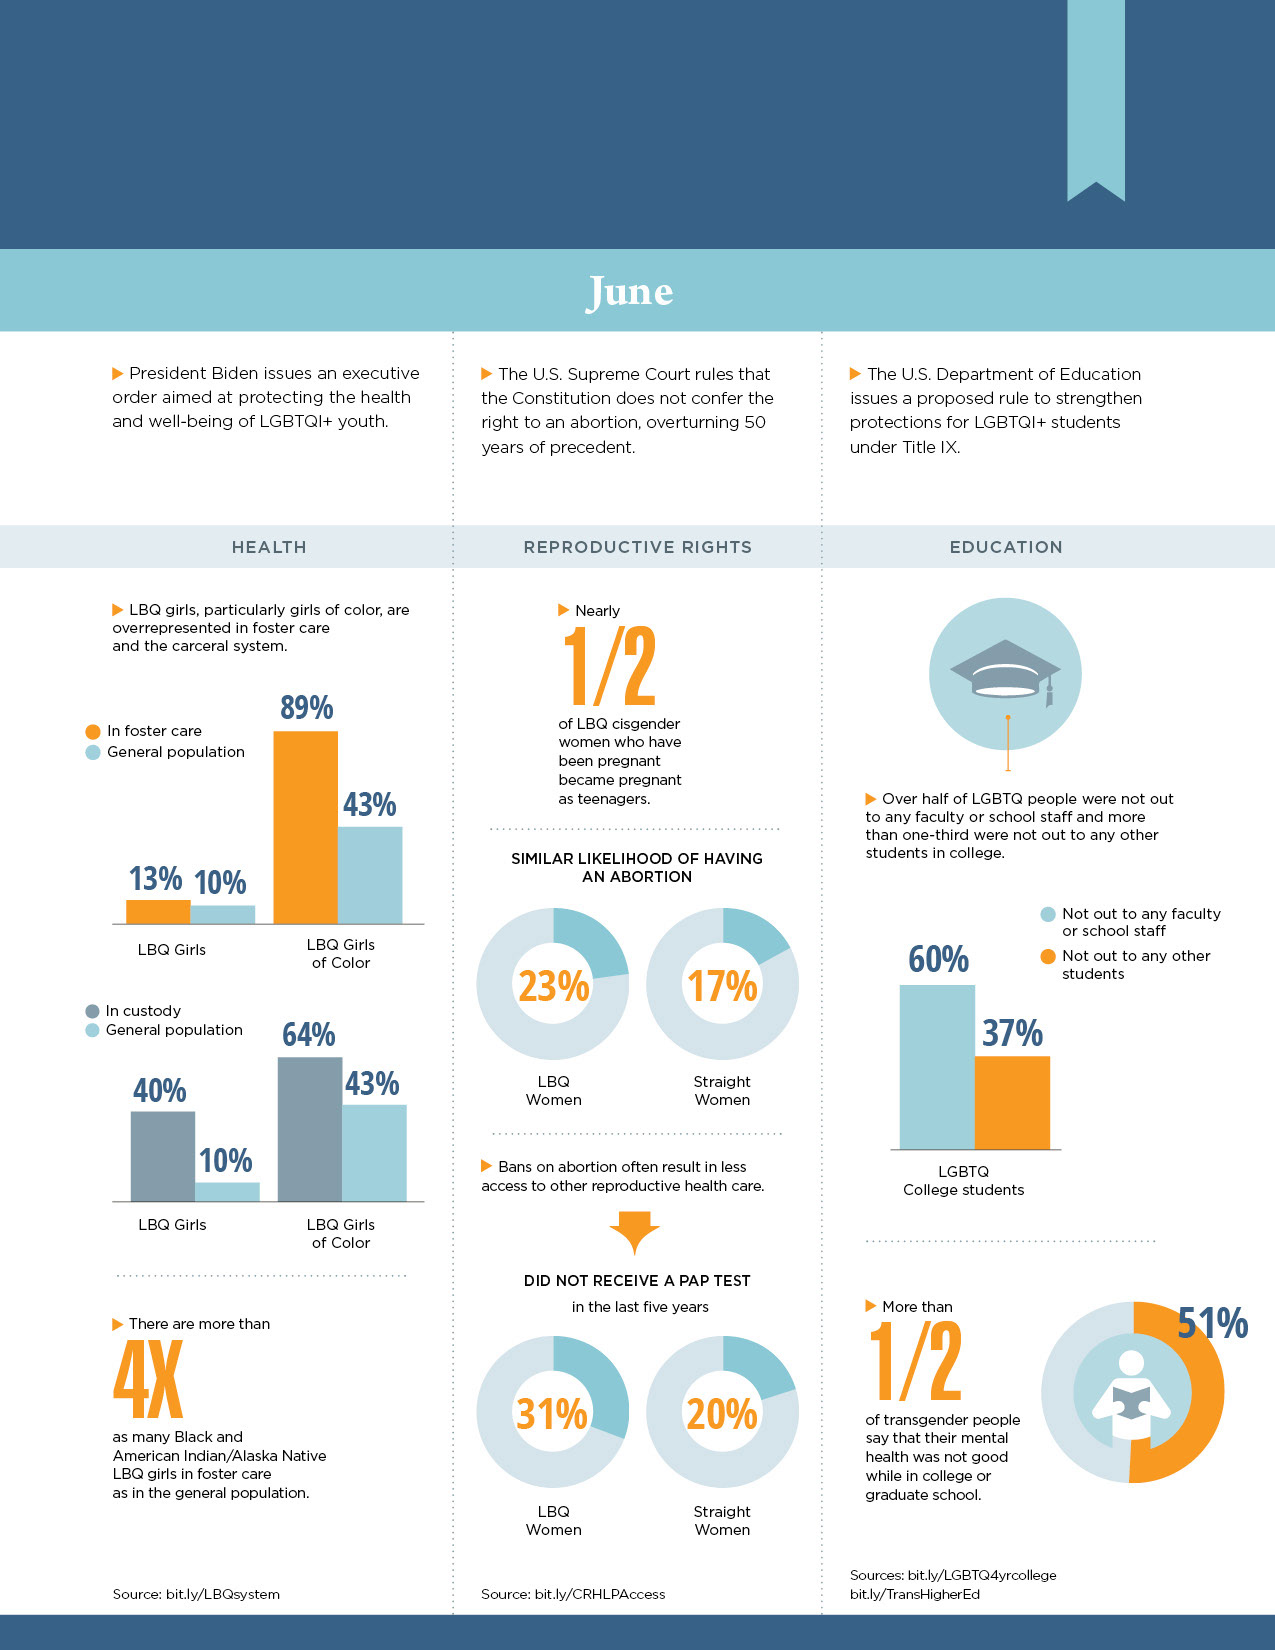
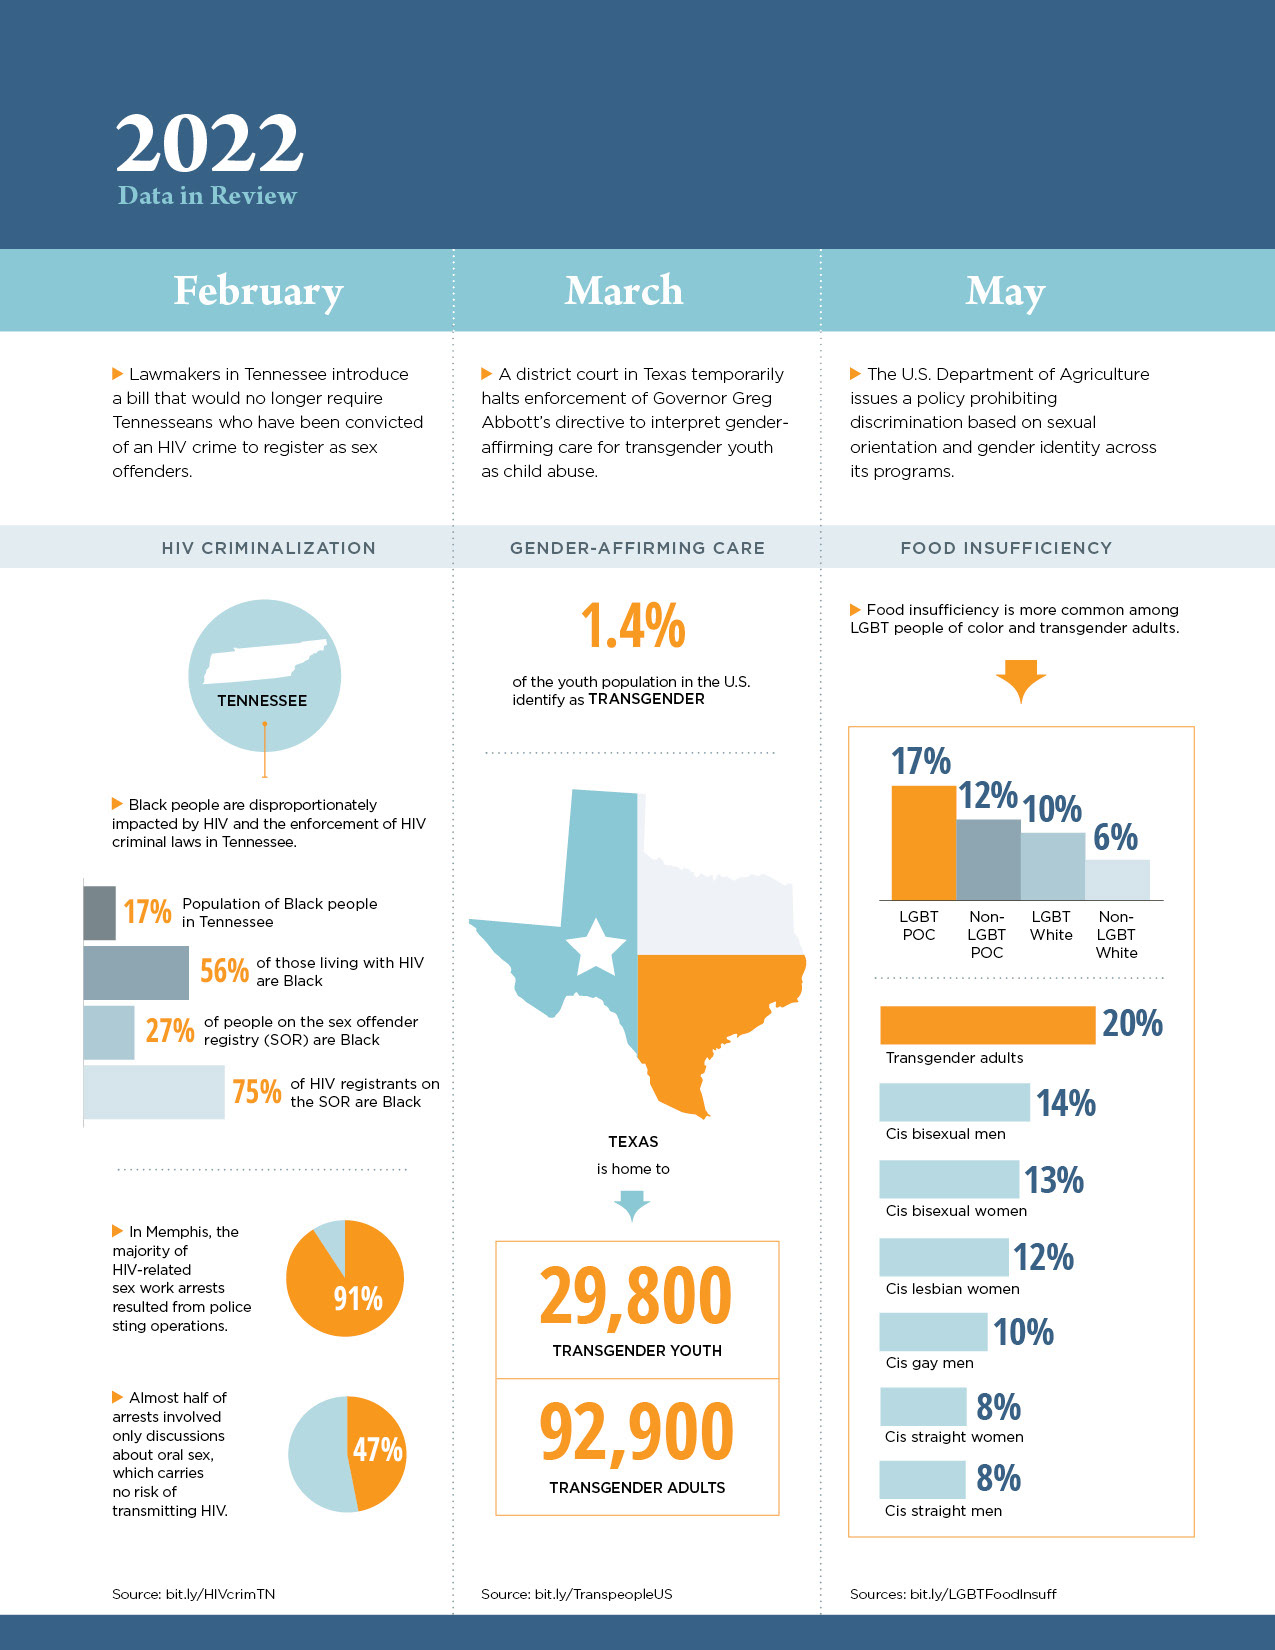
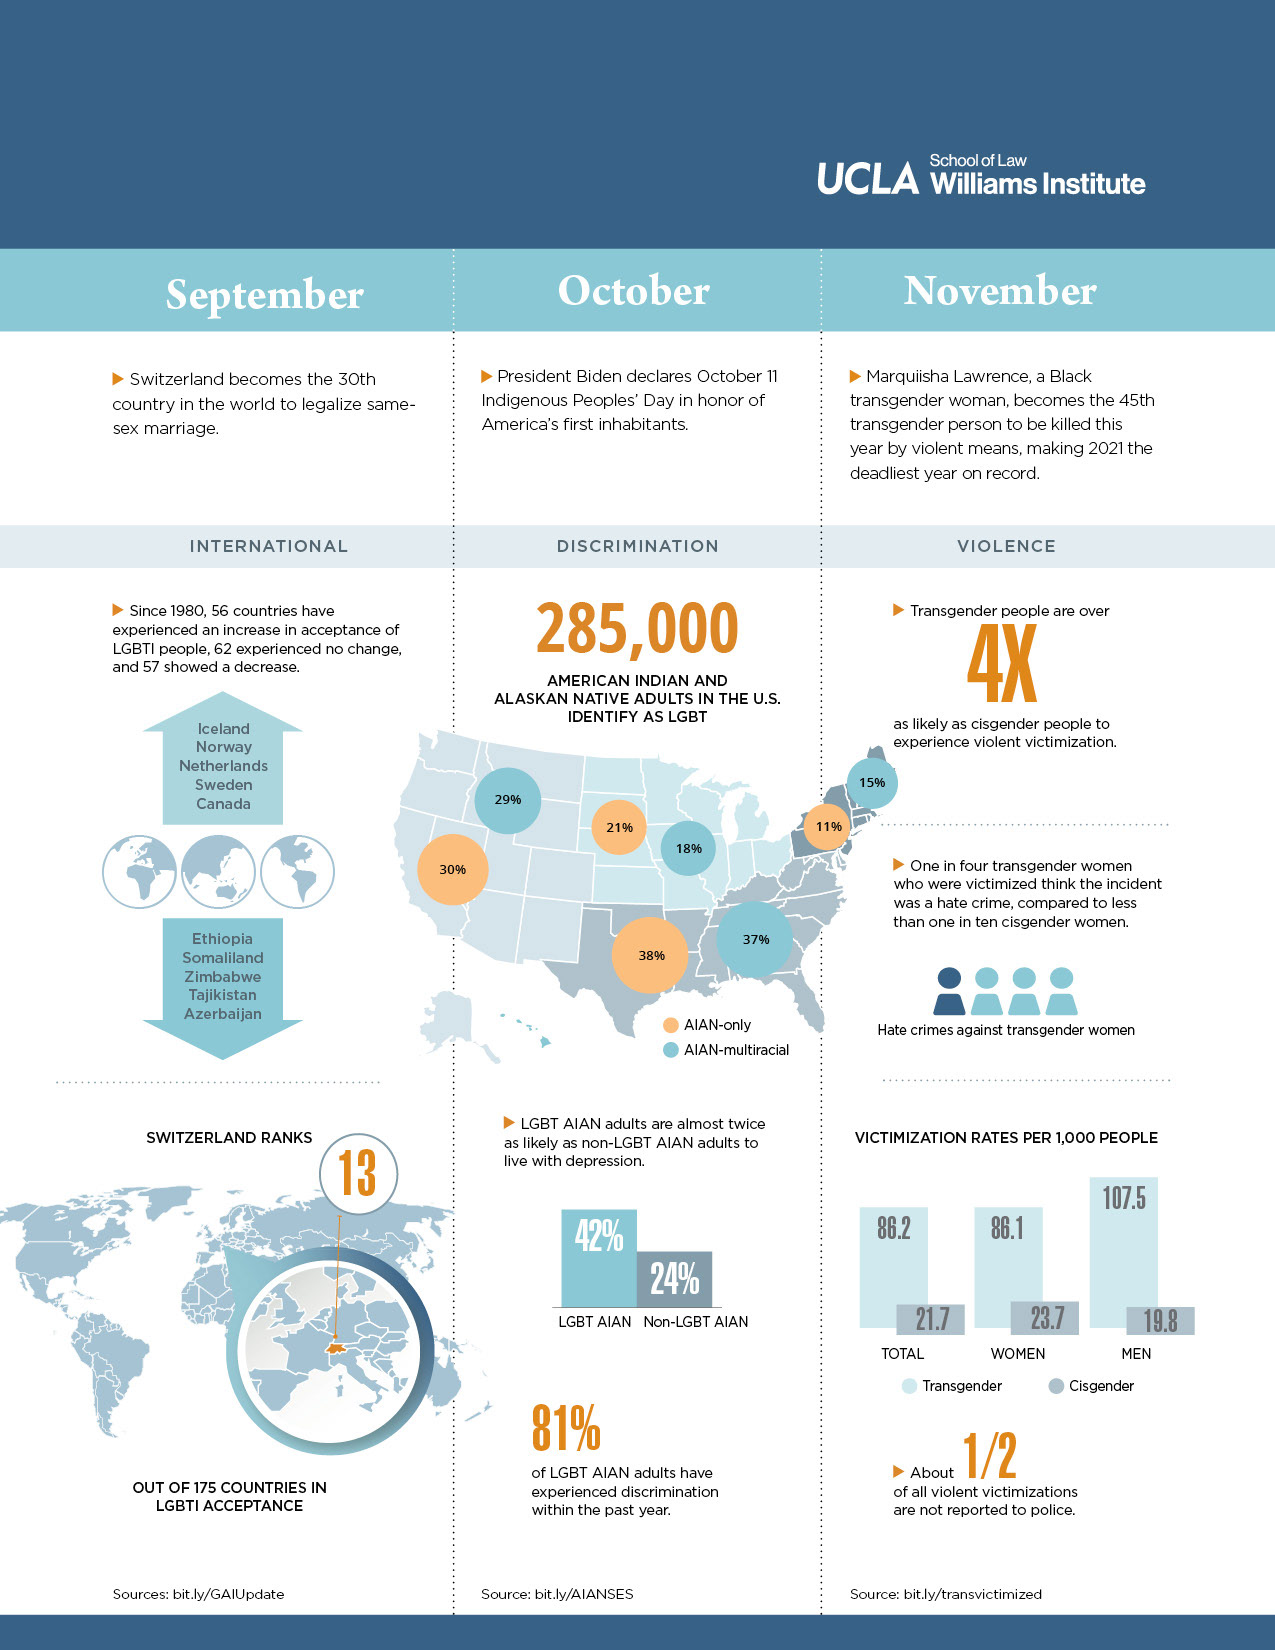
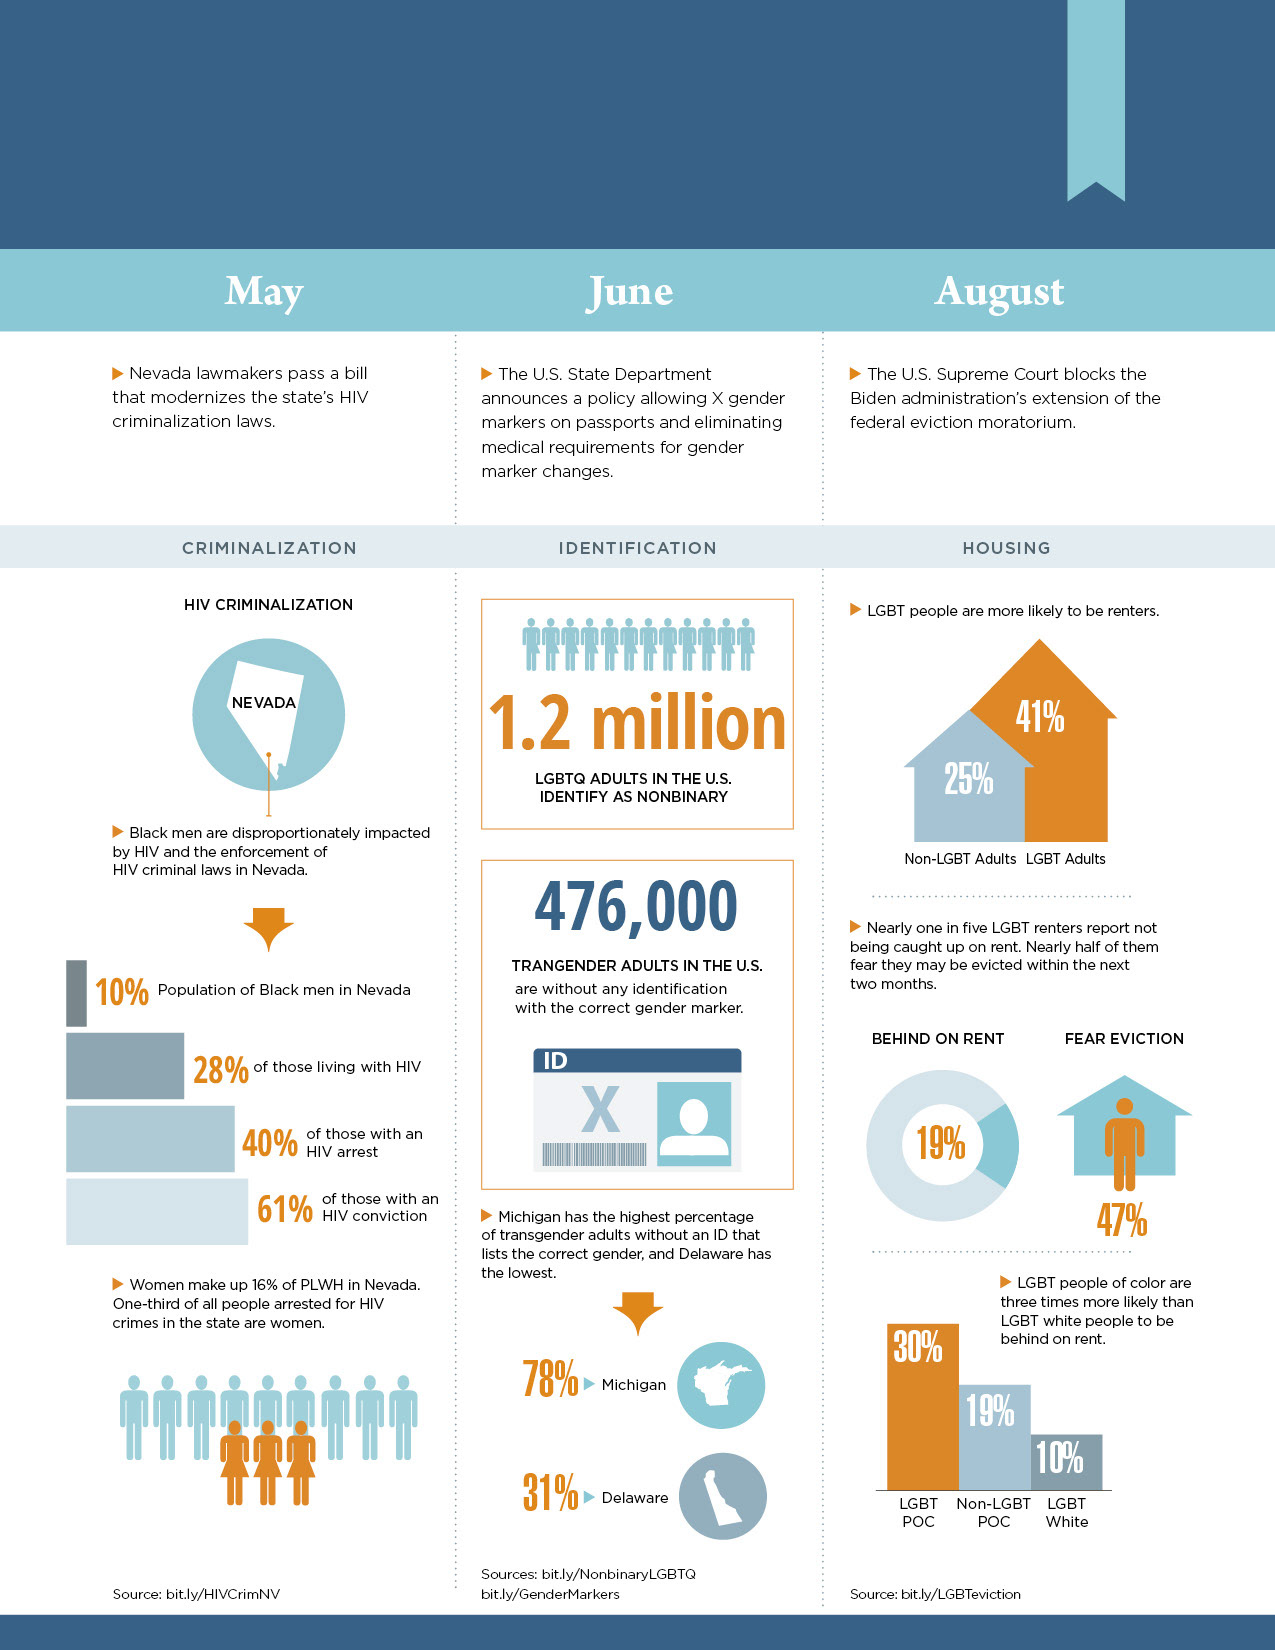
A selection of data visualization design for infographics and social media posts.


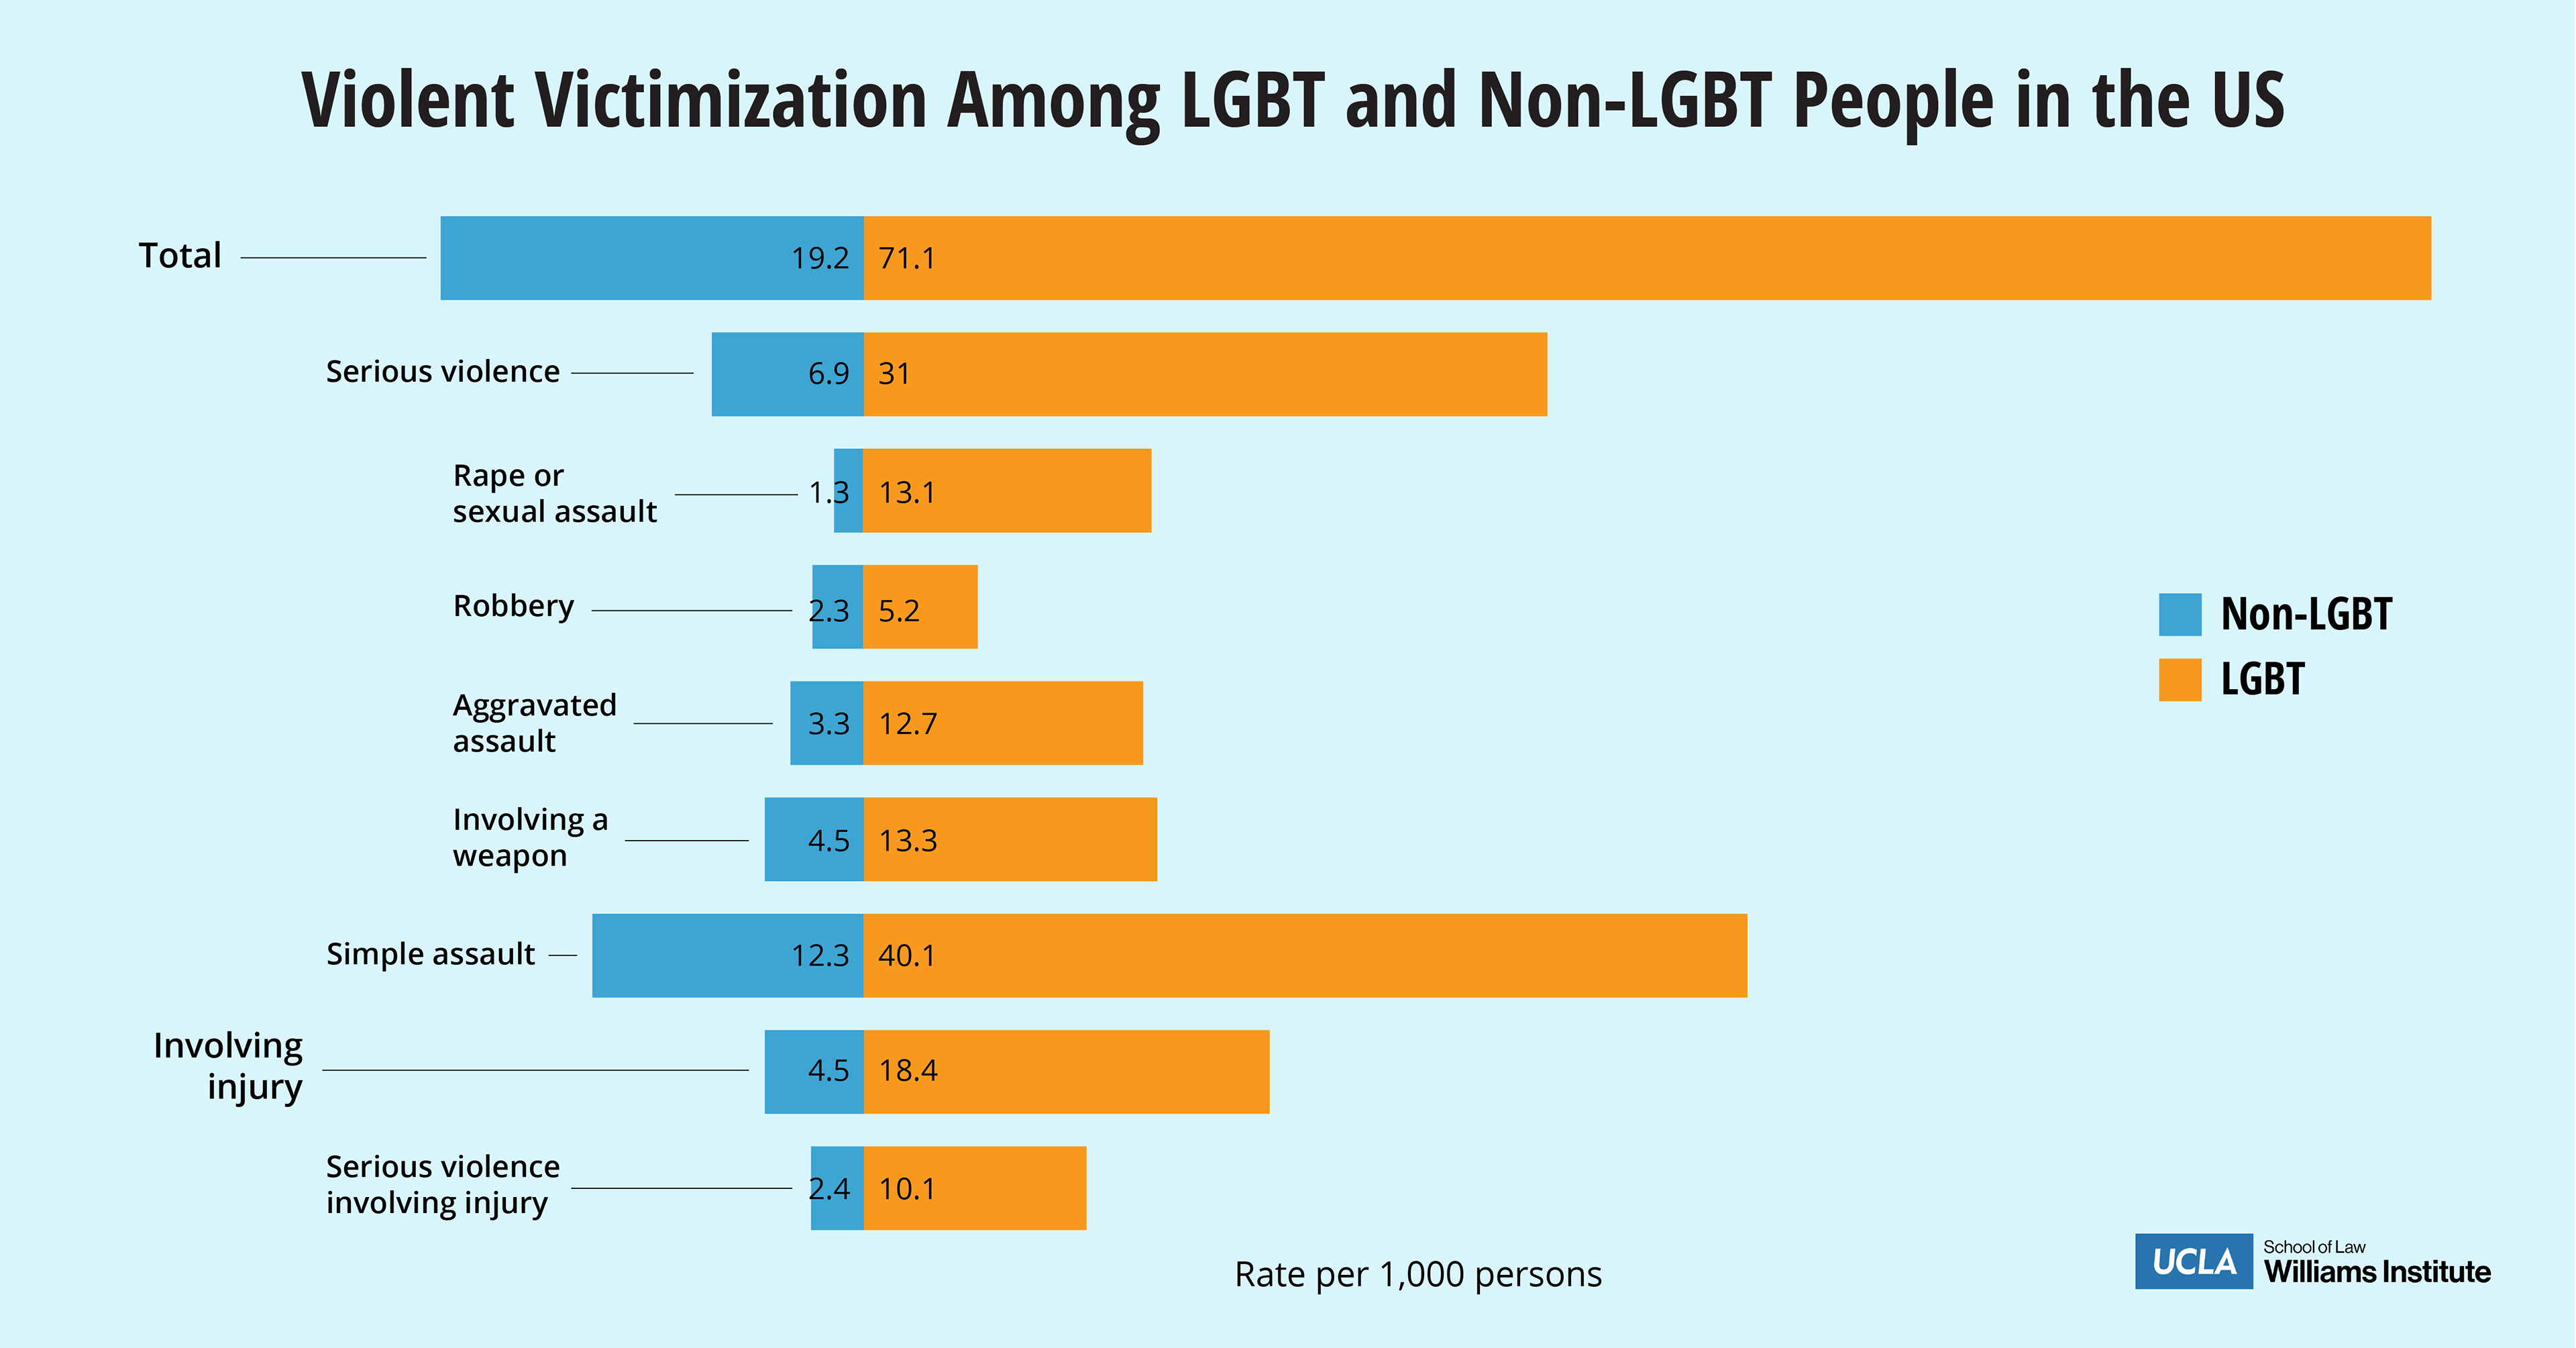

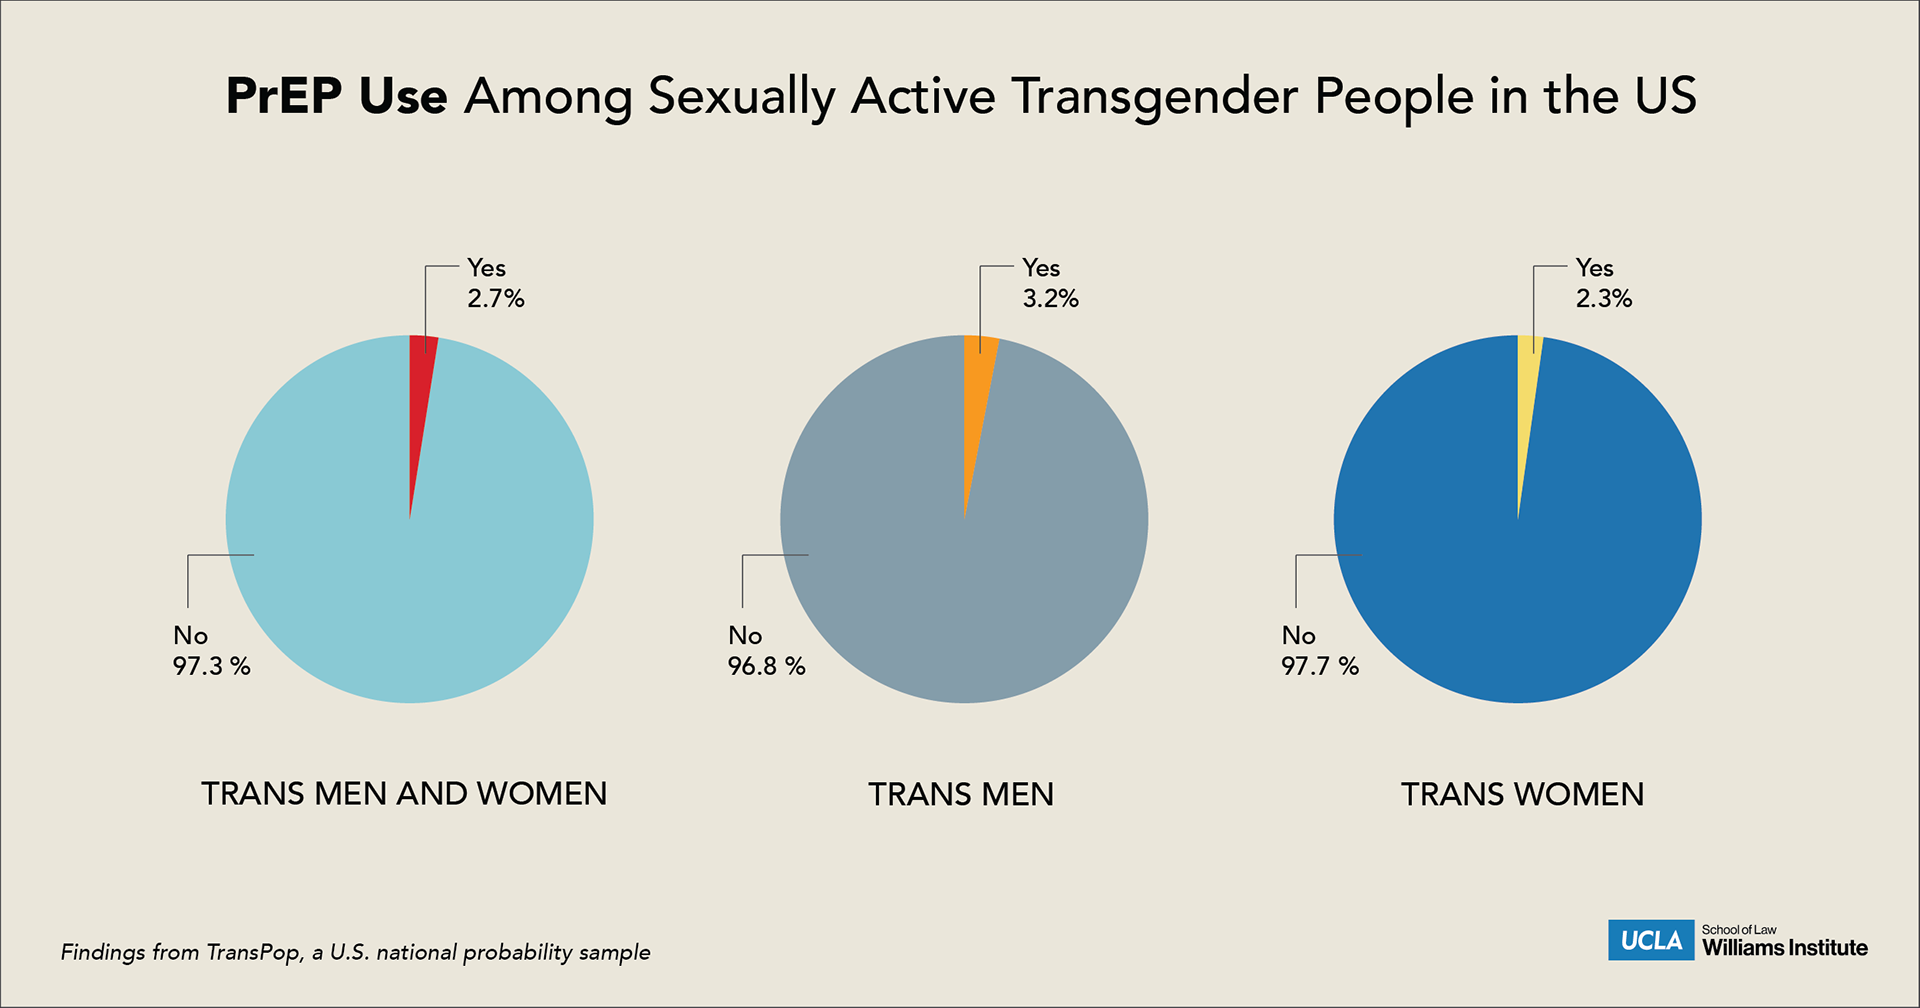
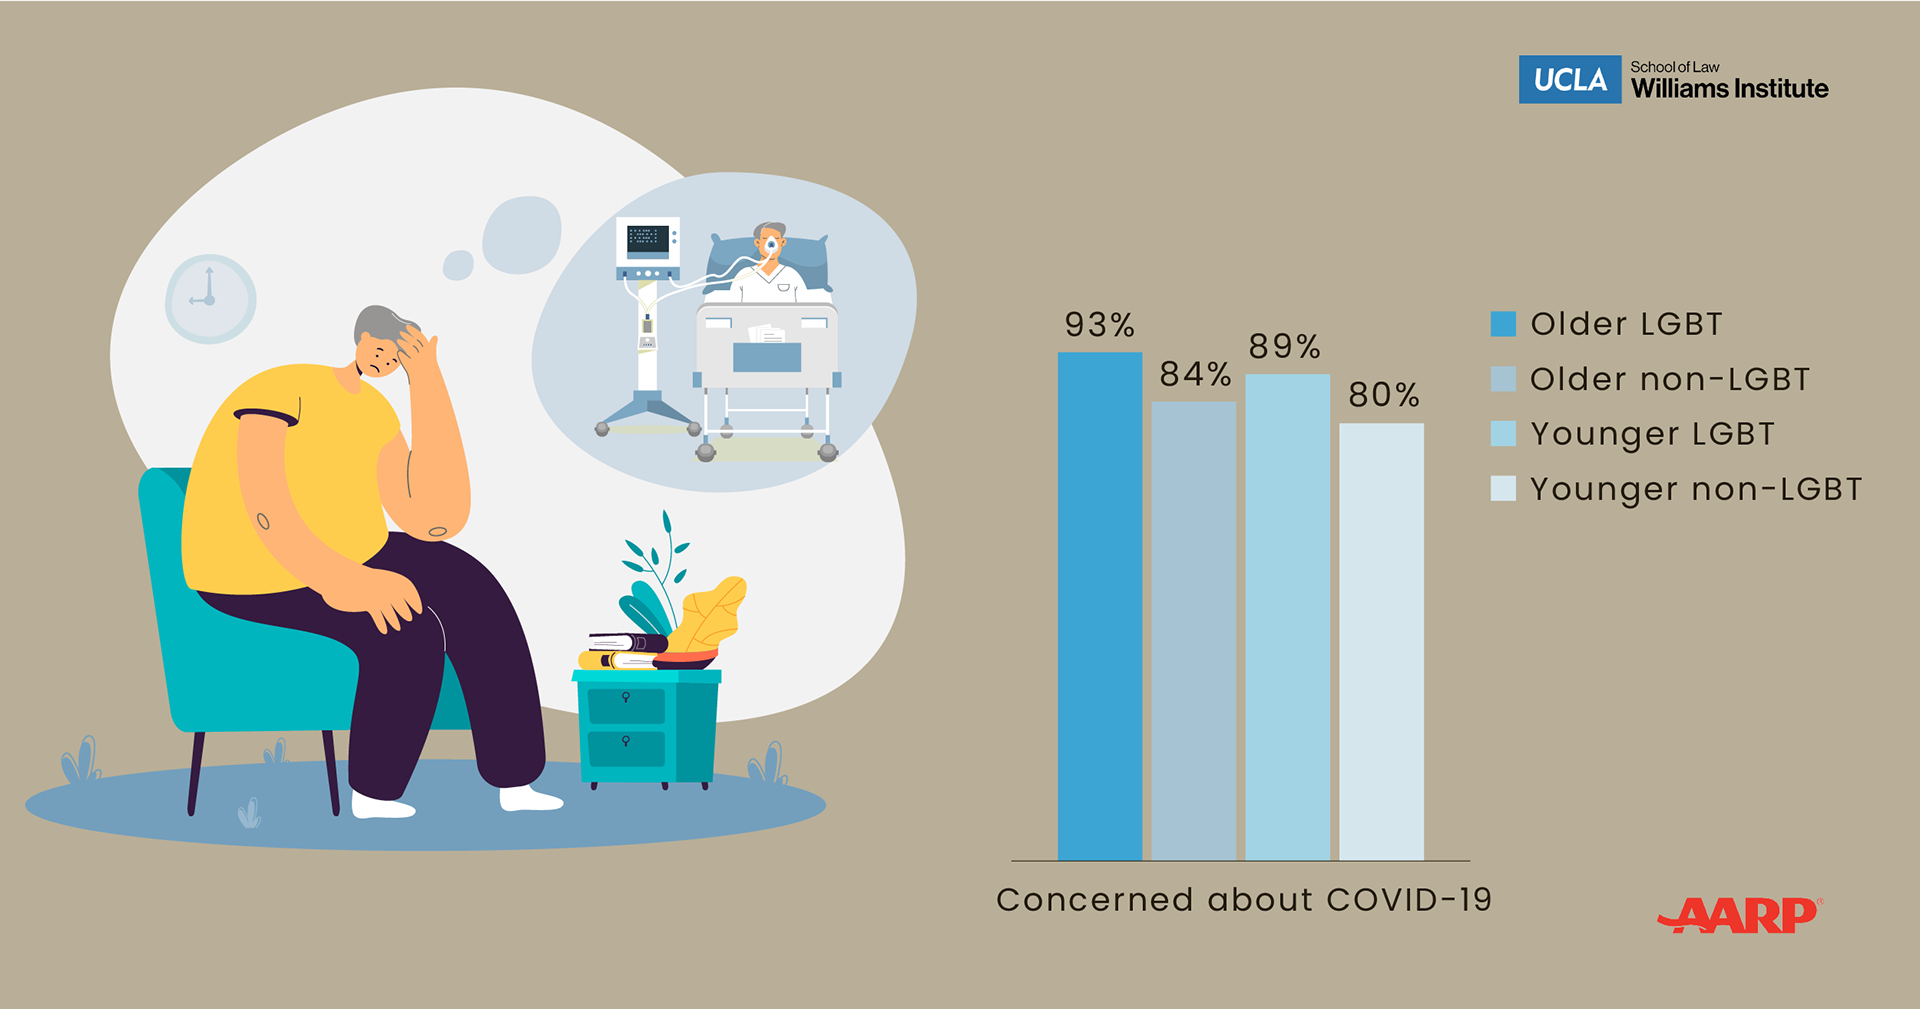
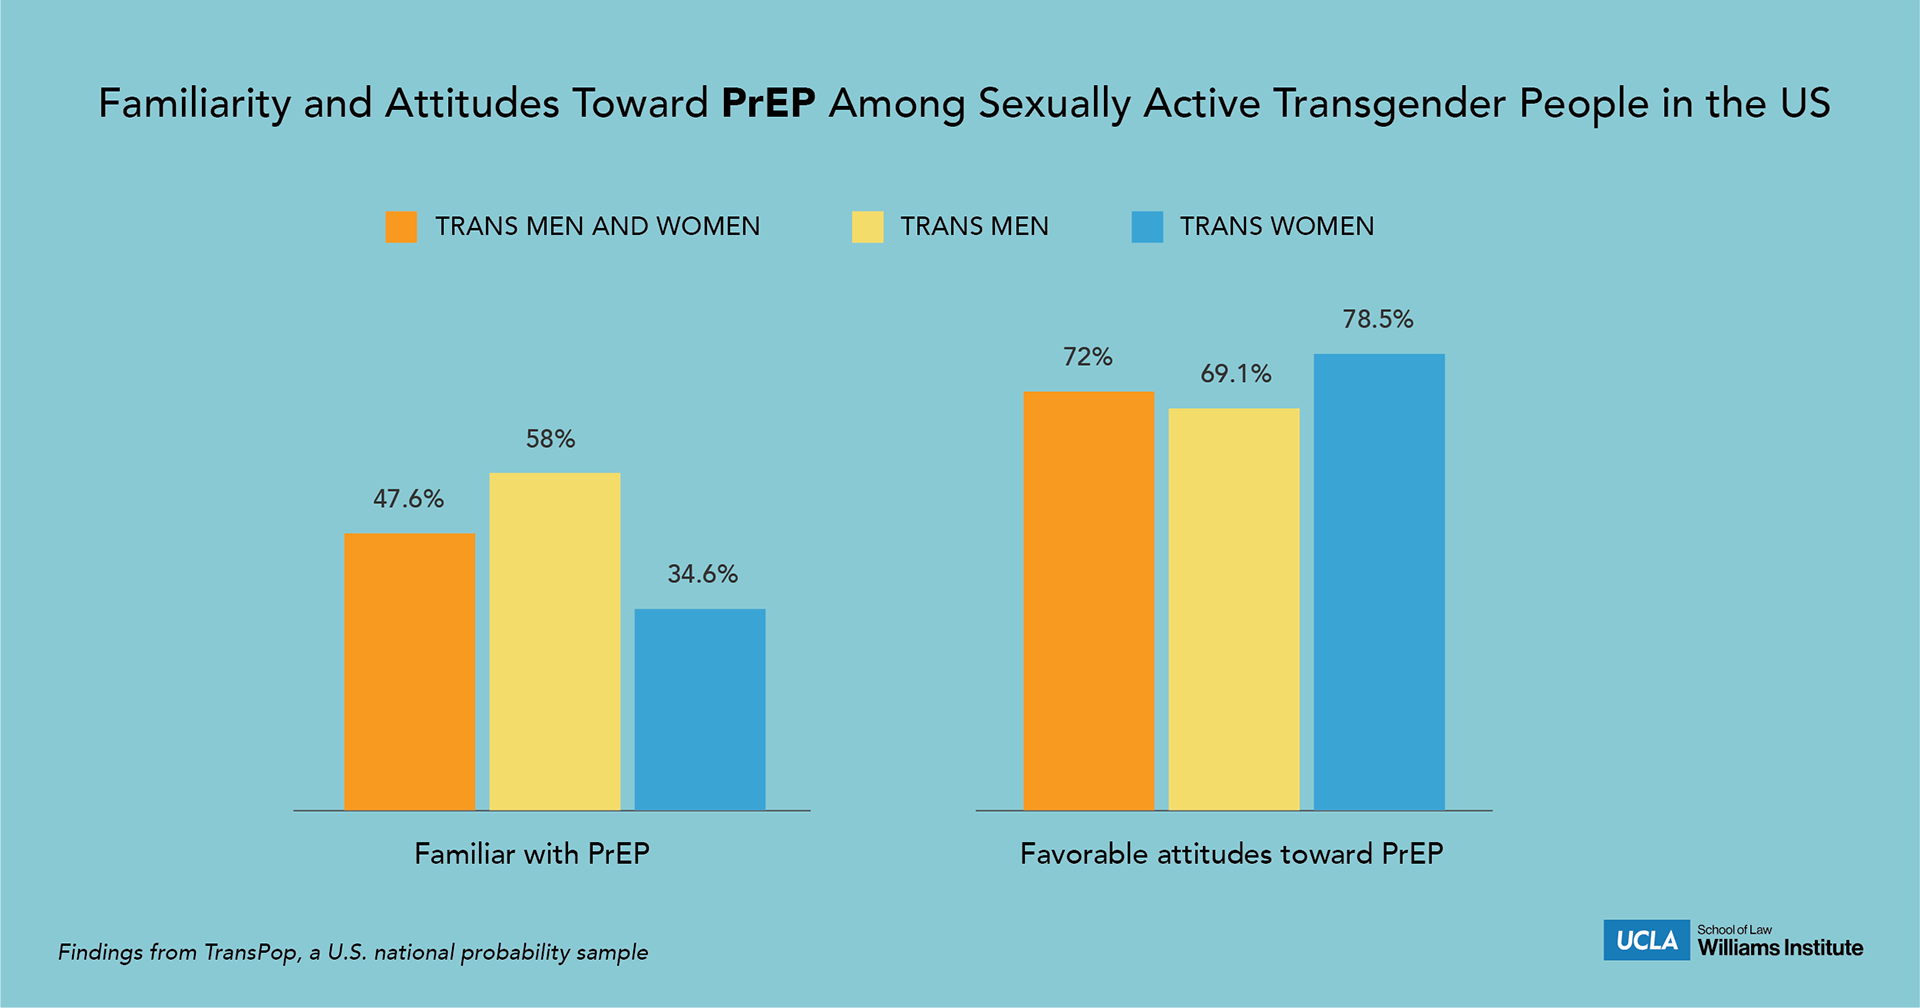
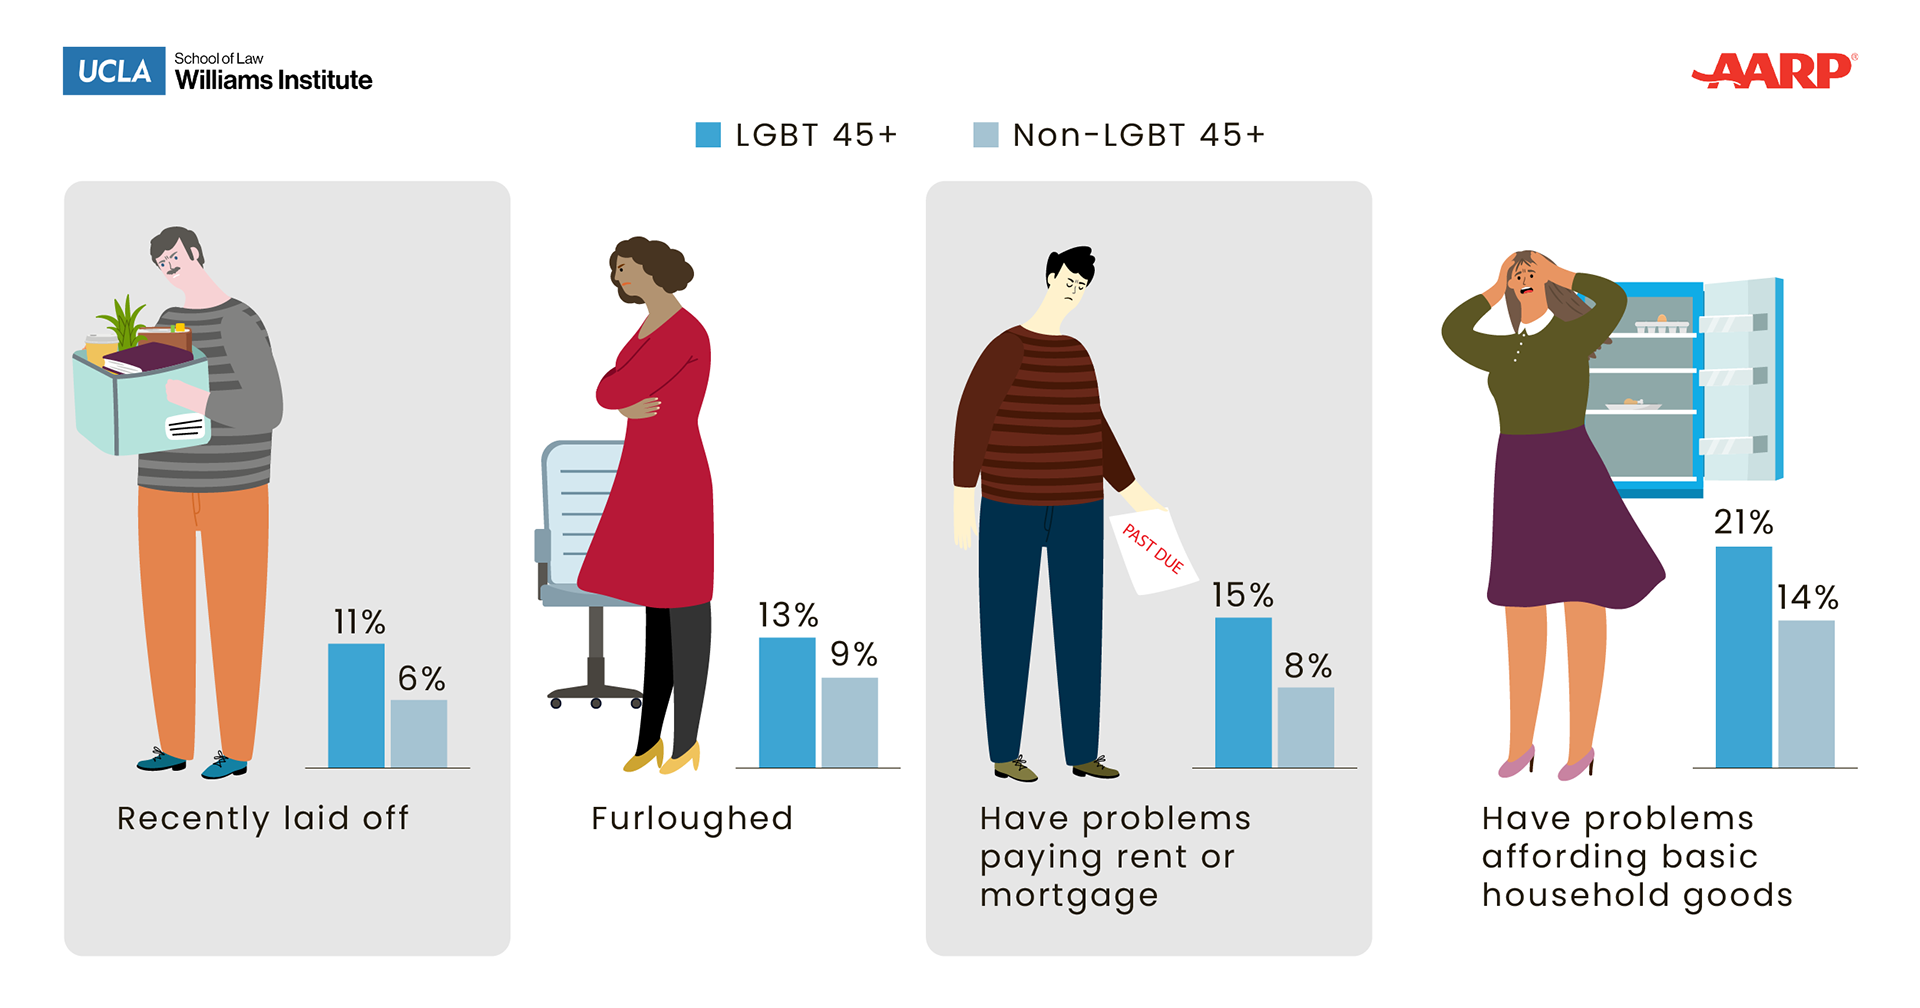
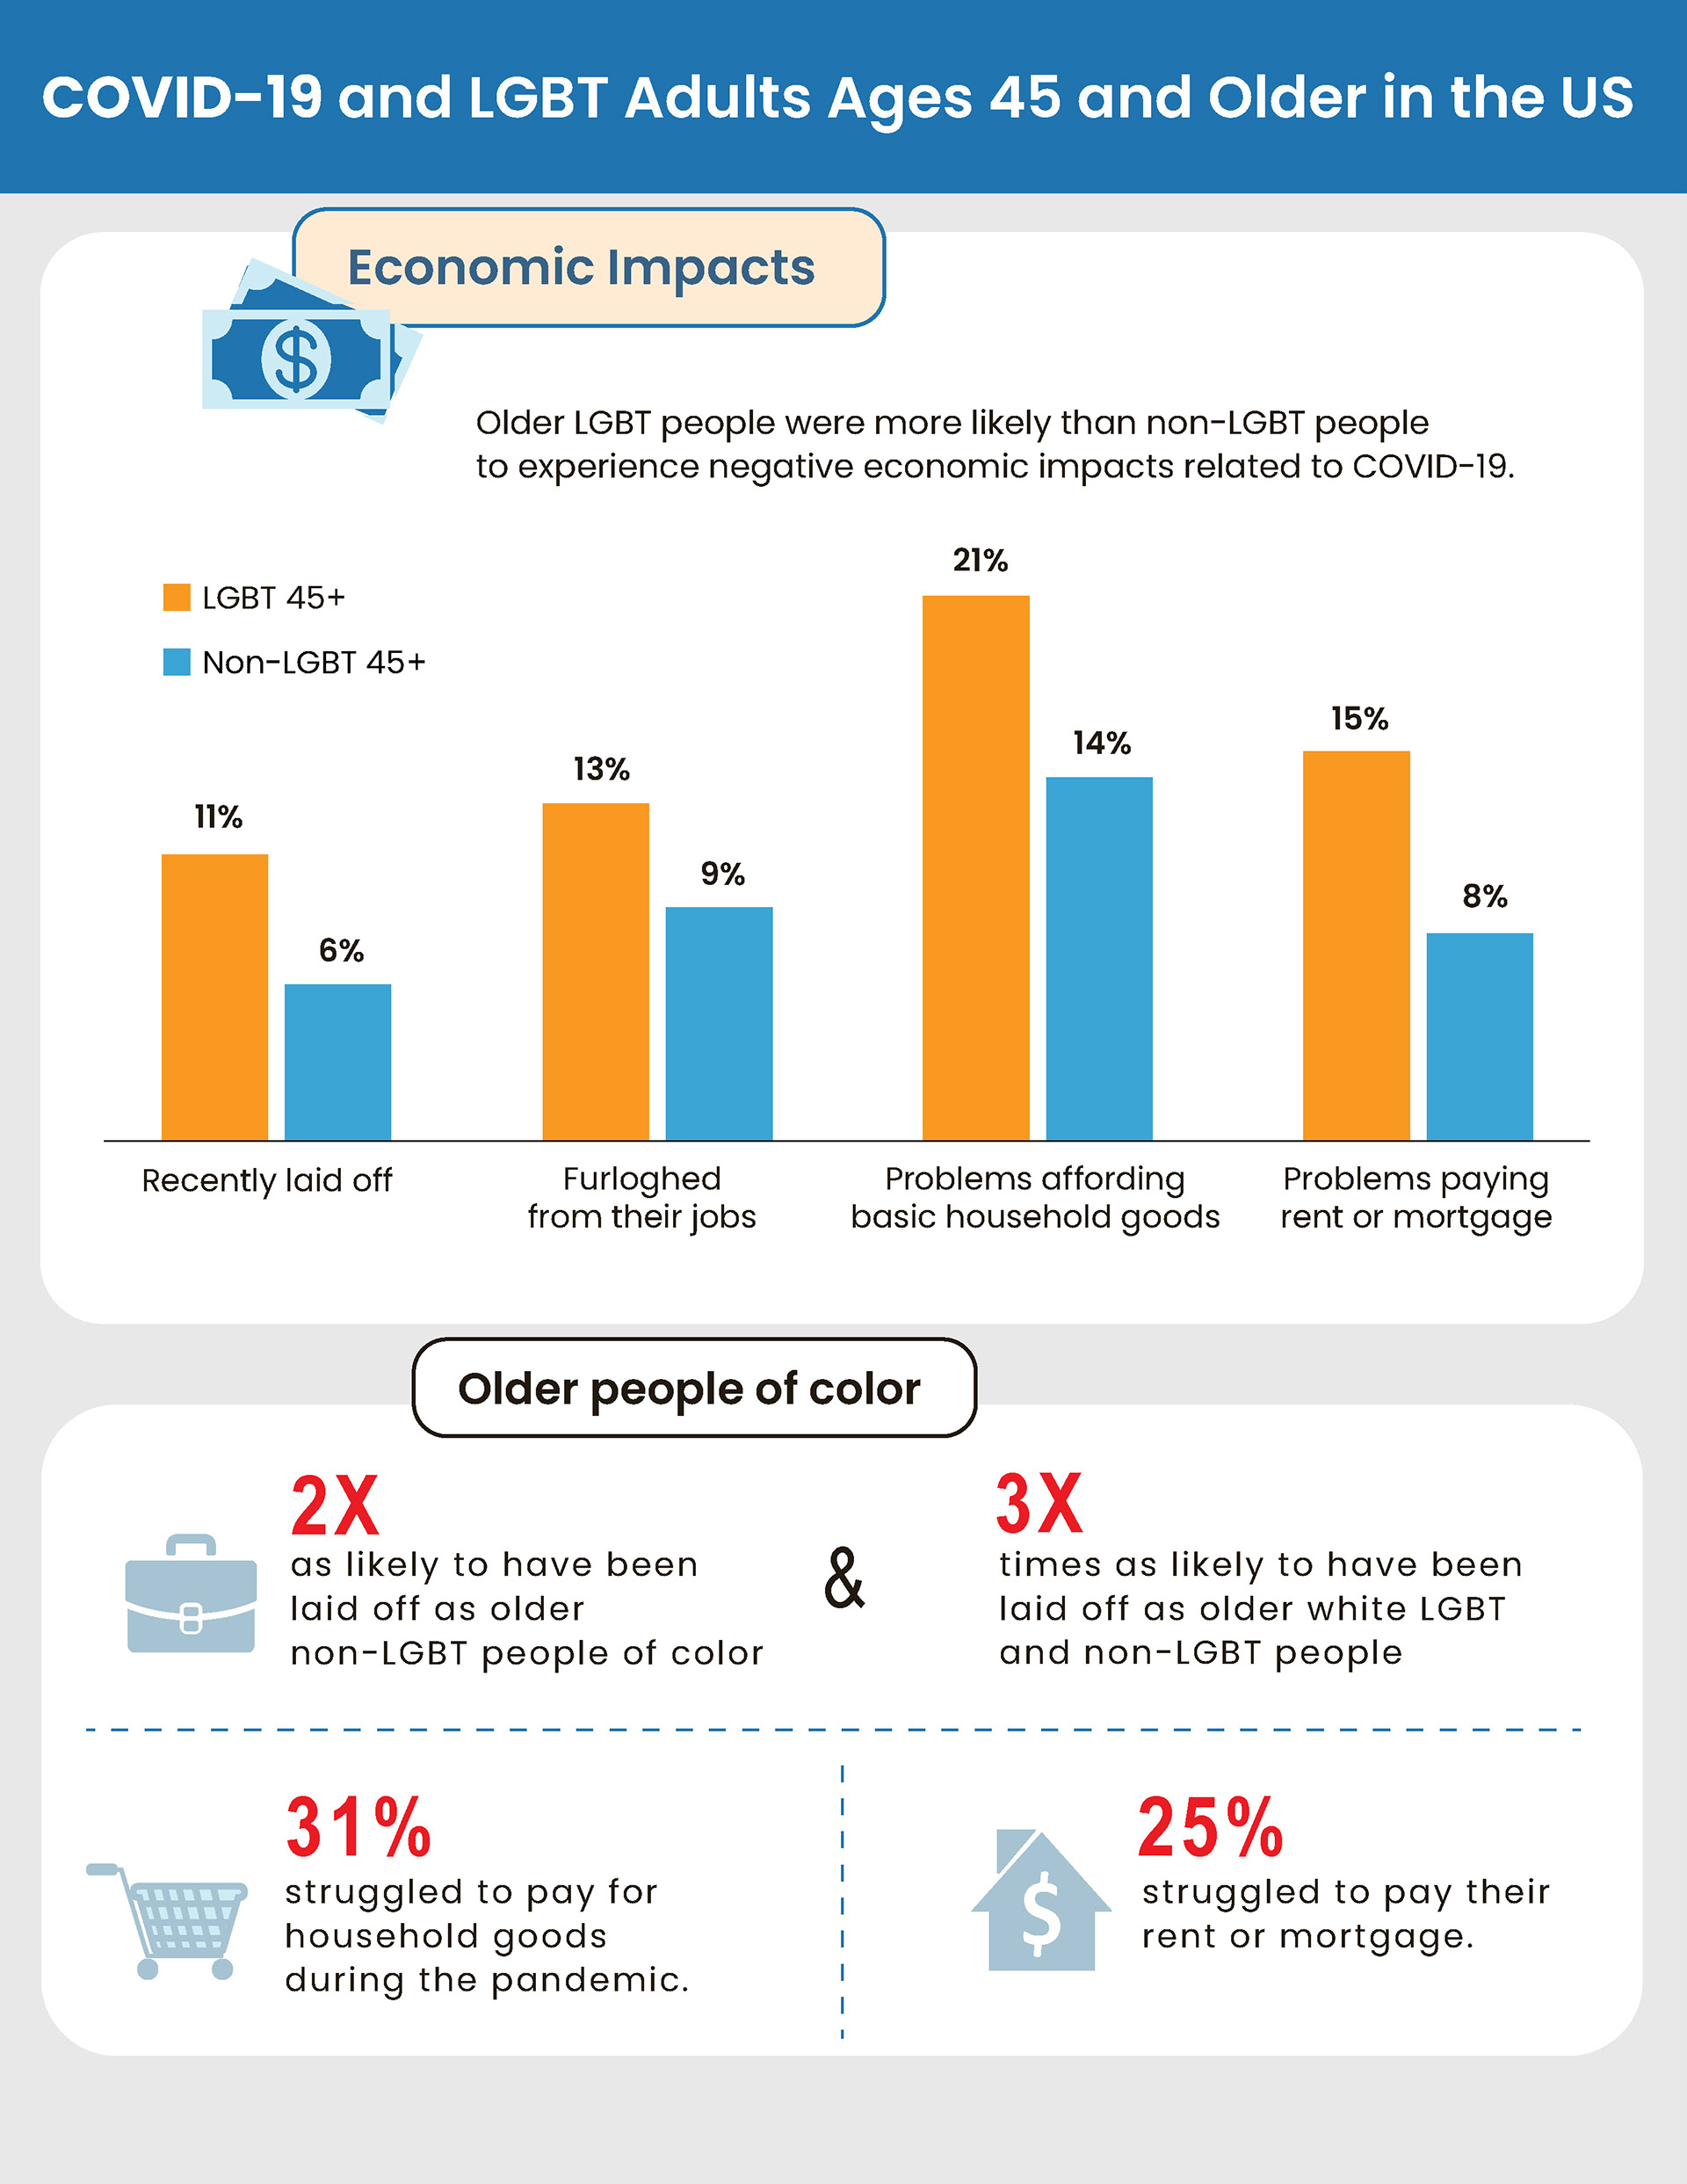


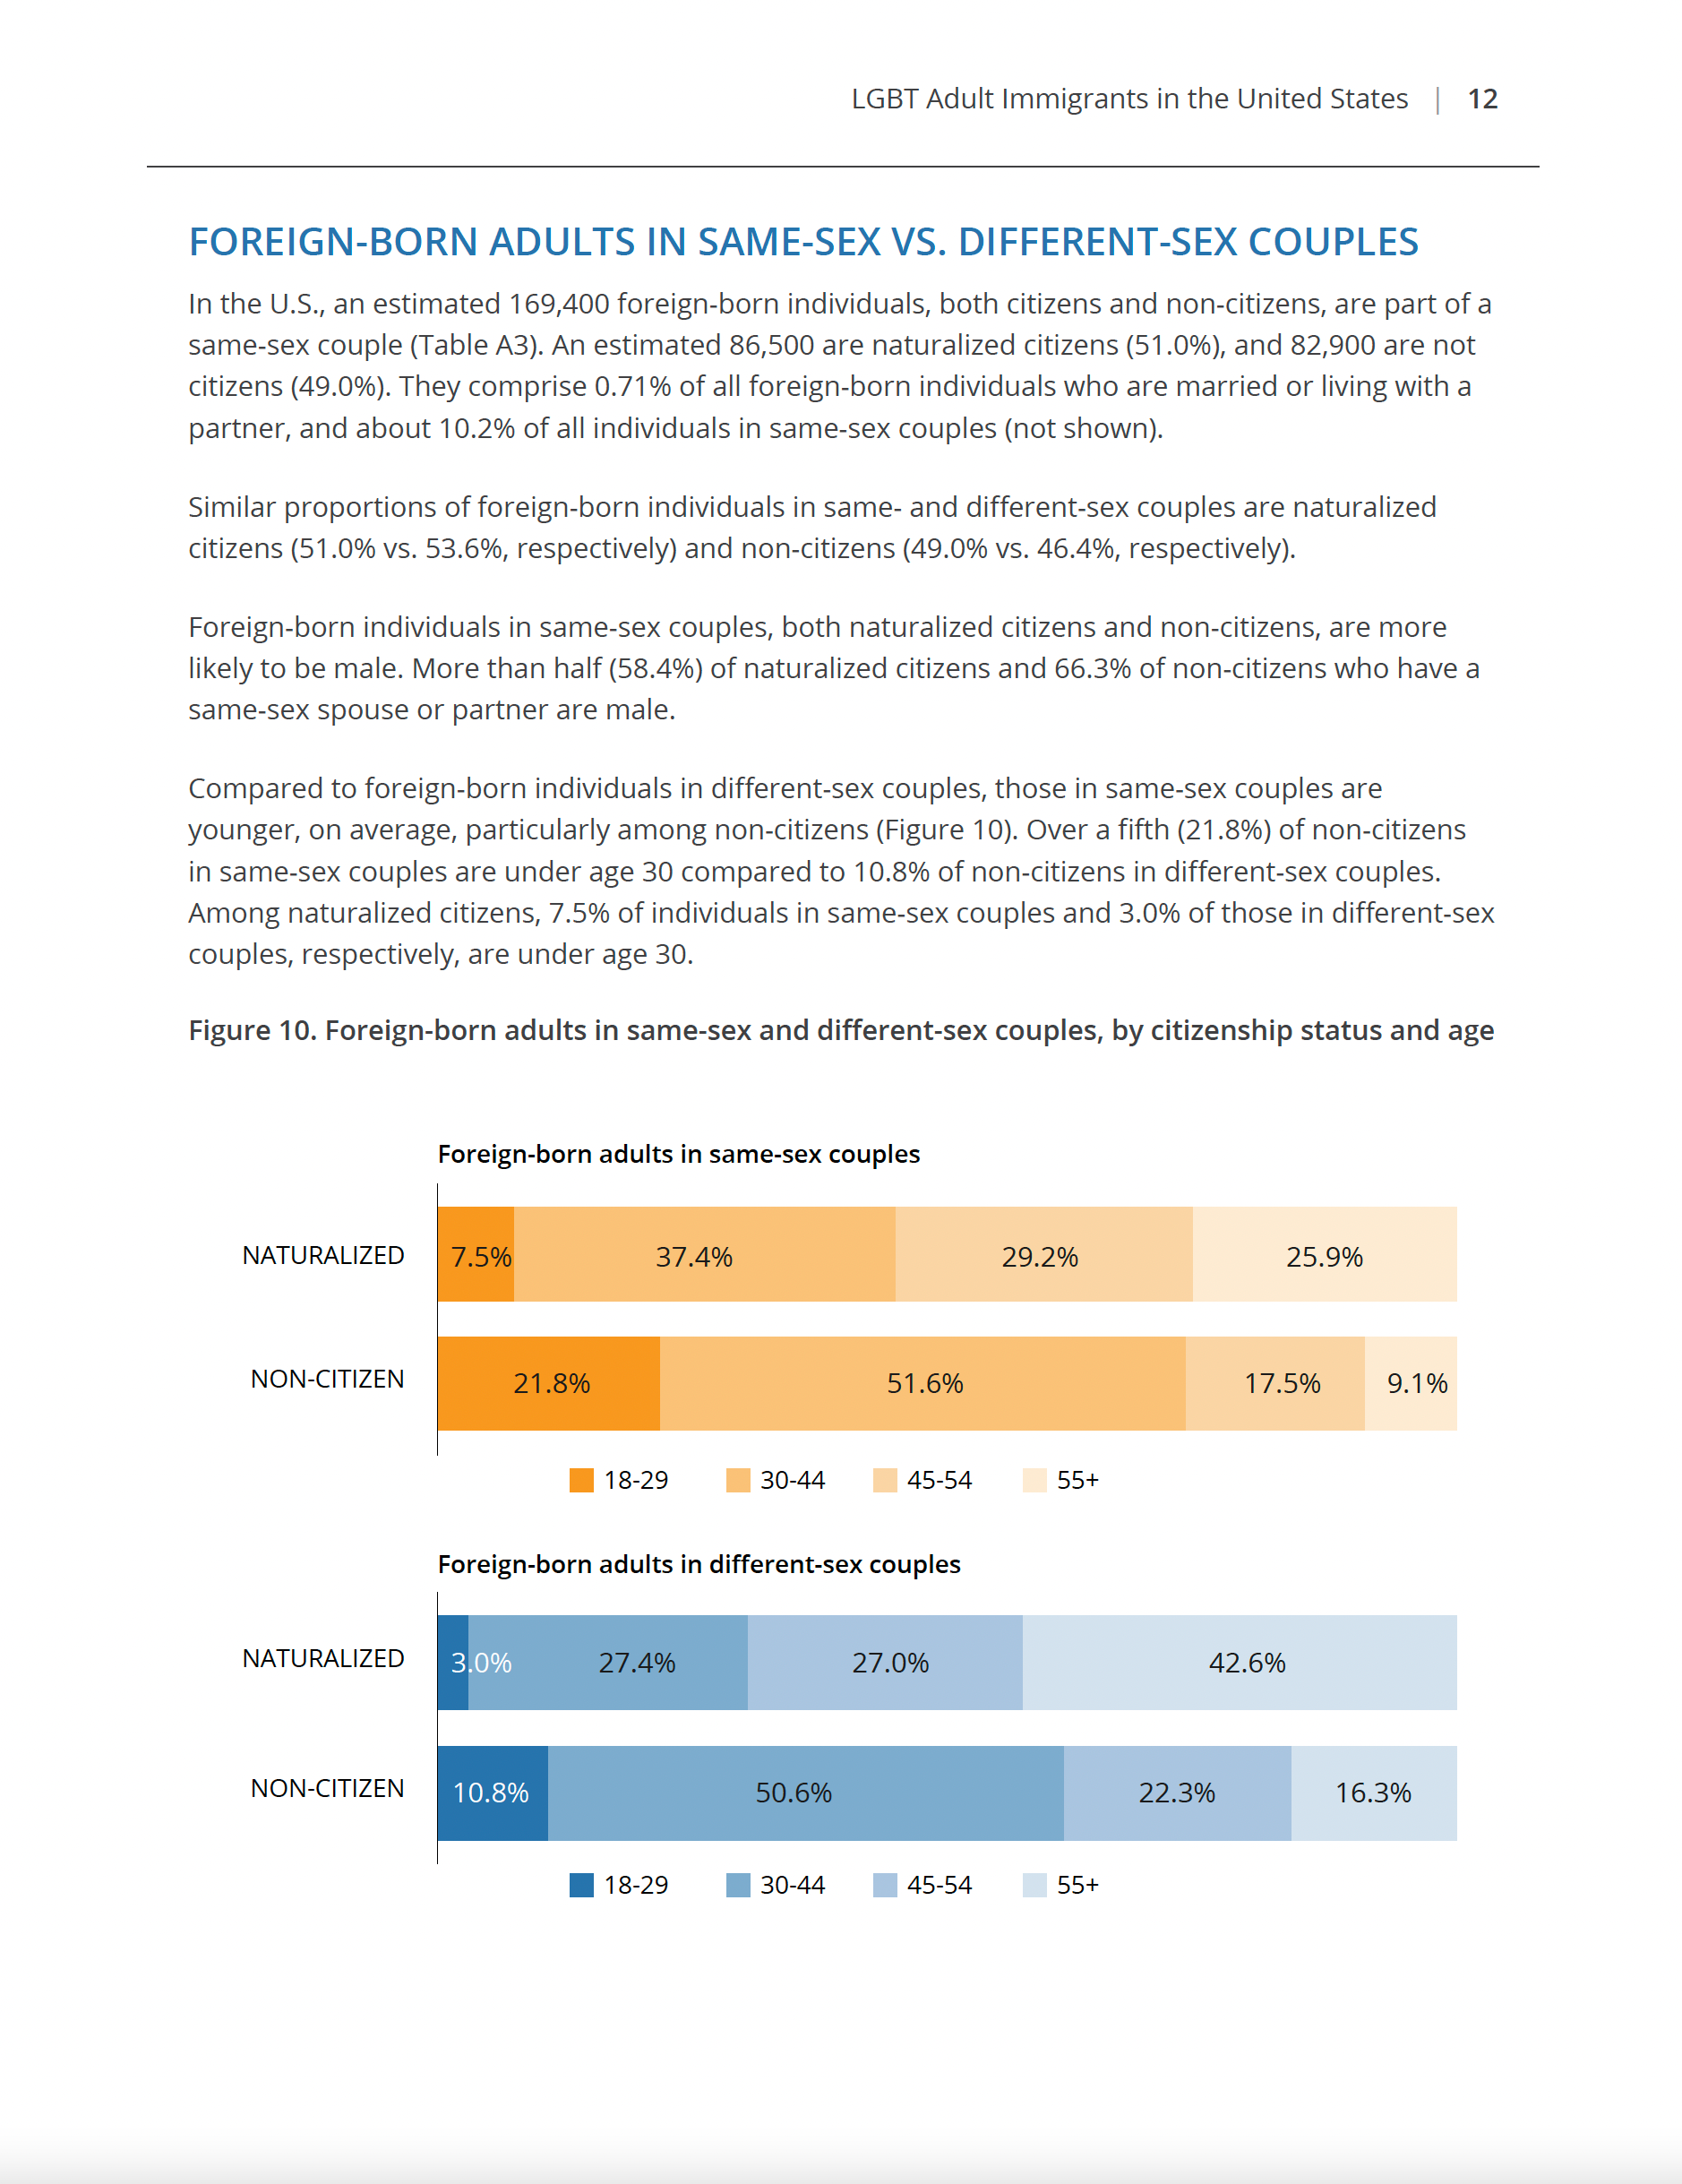
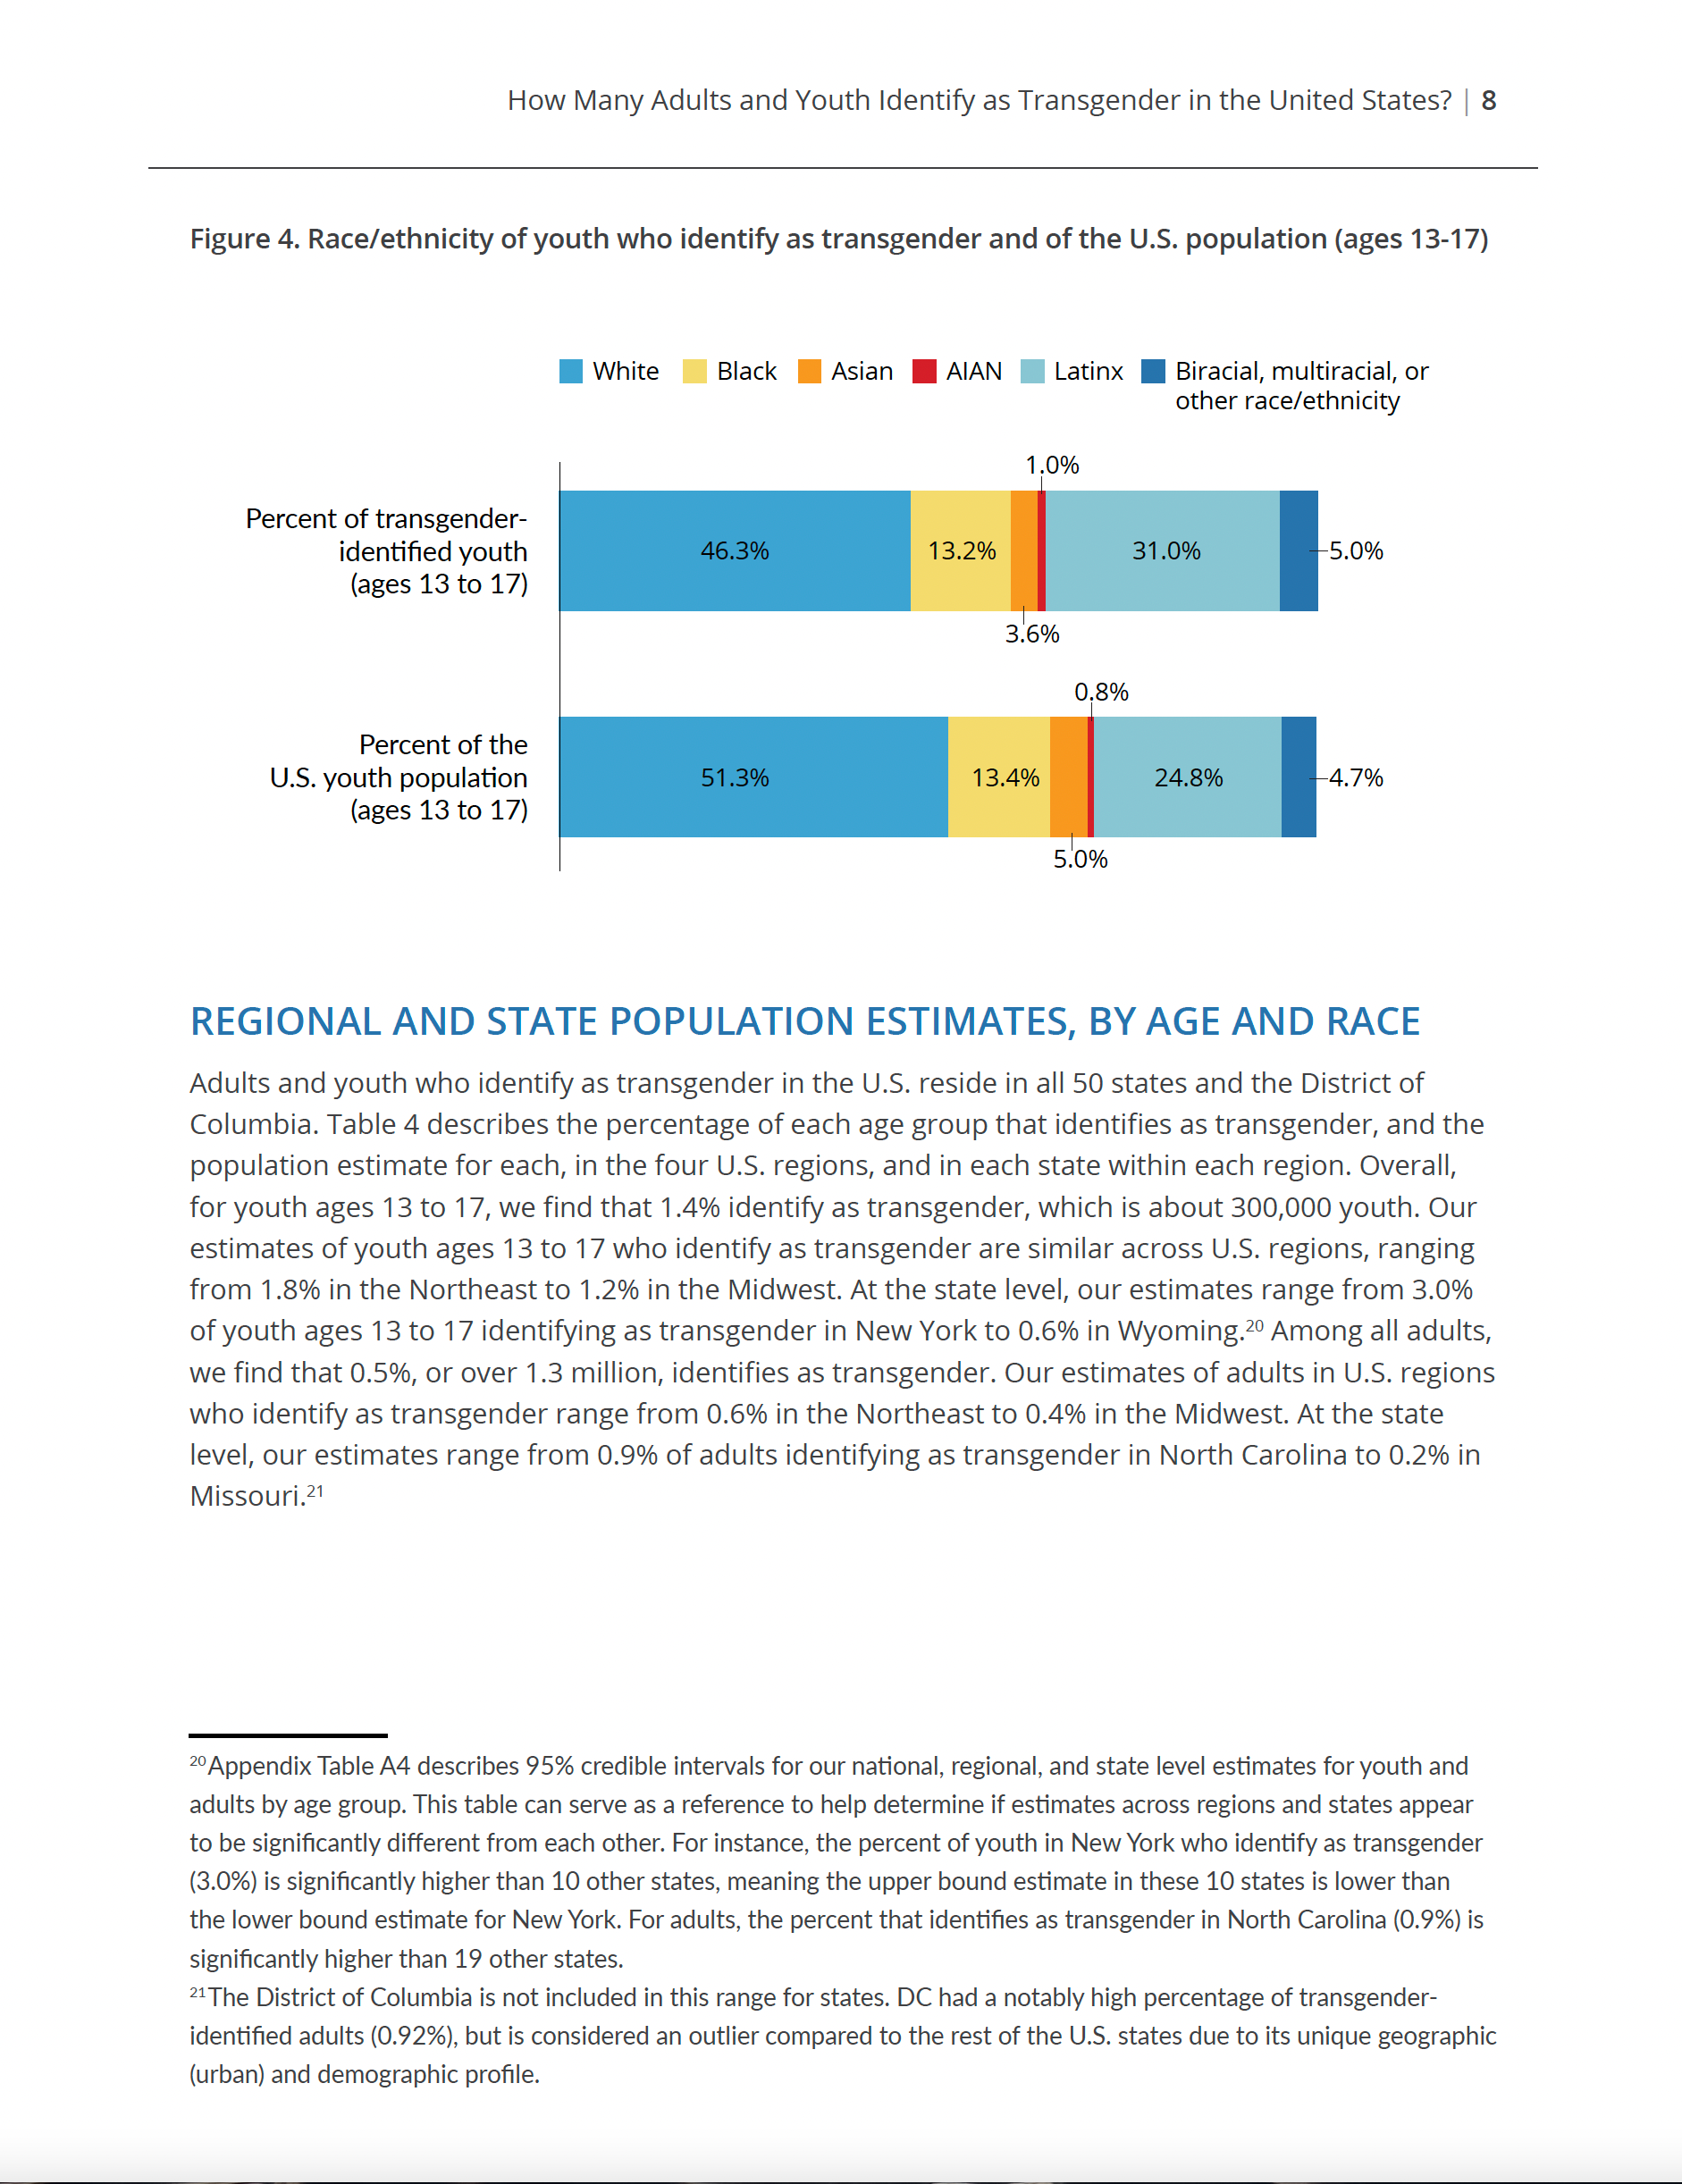
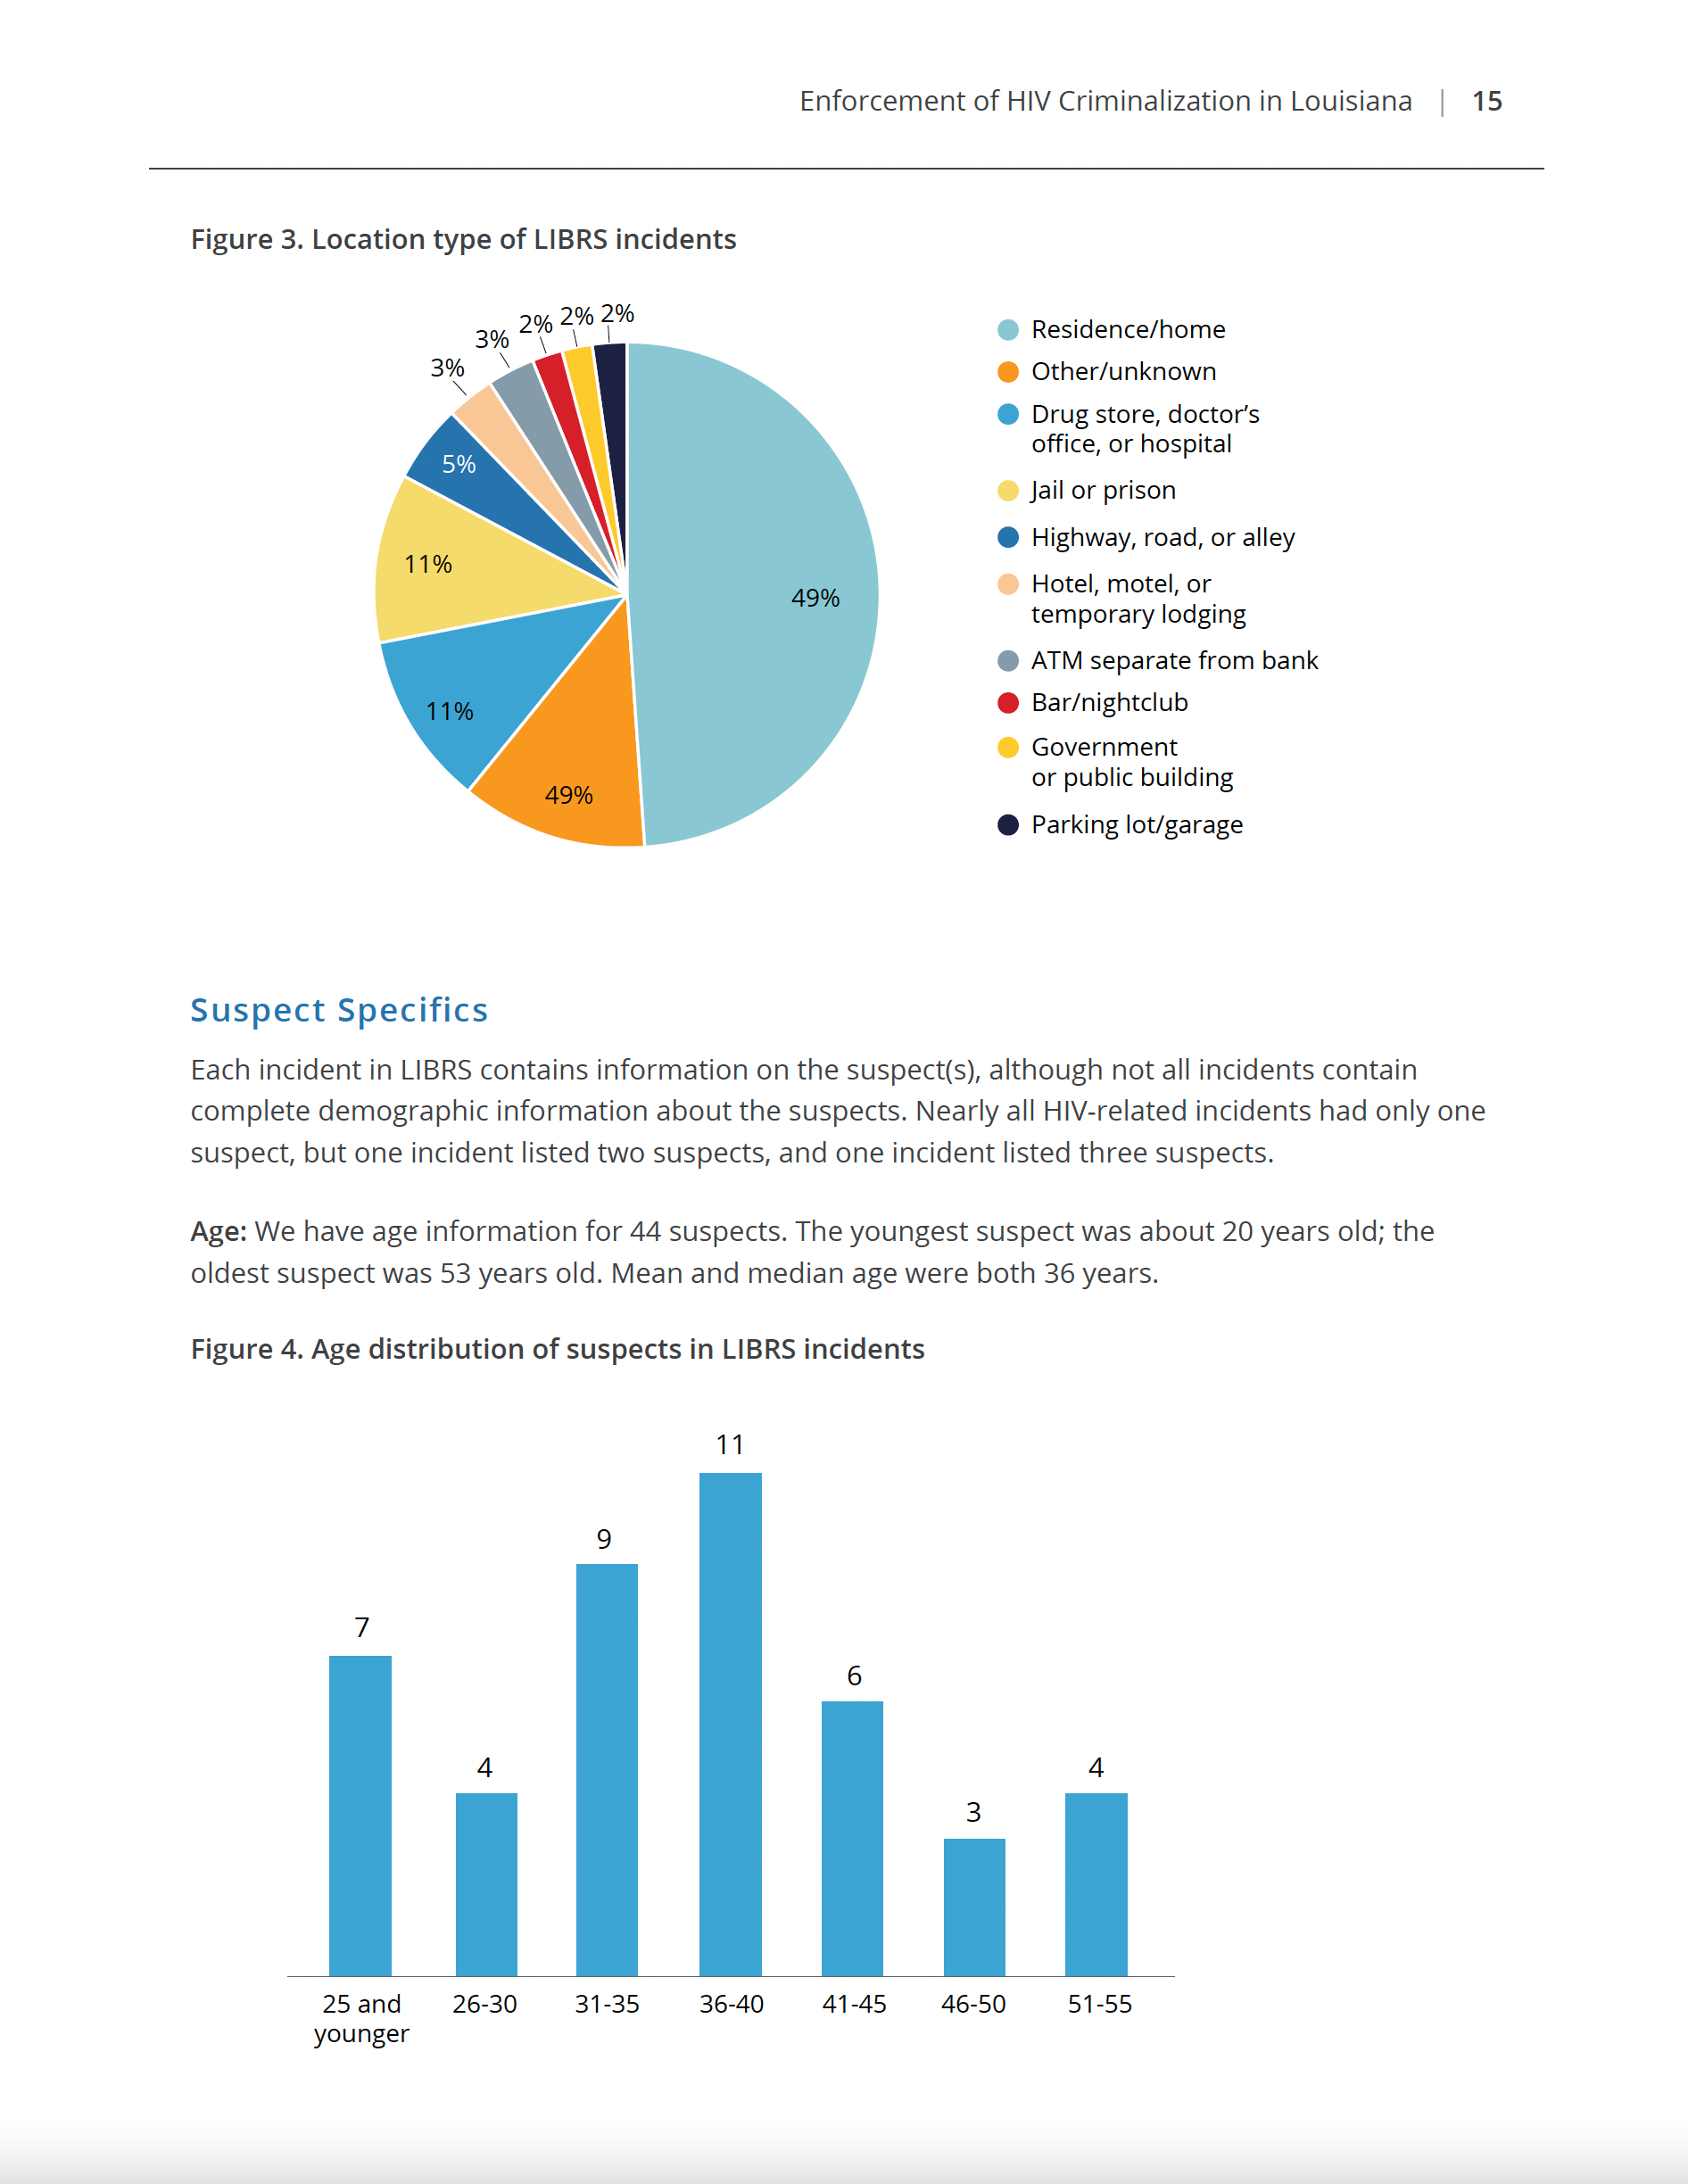
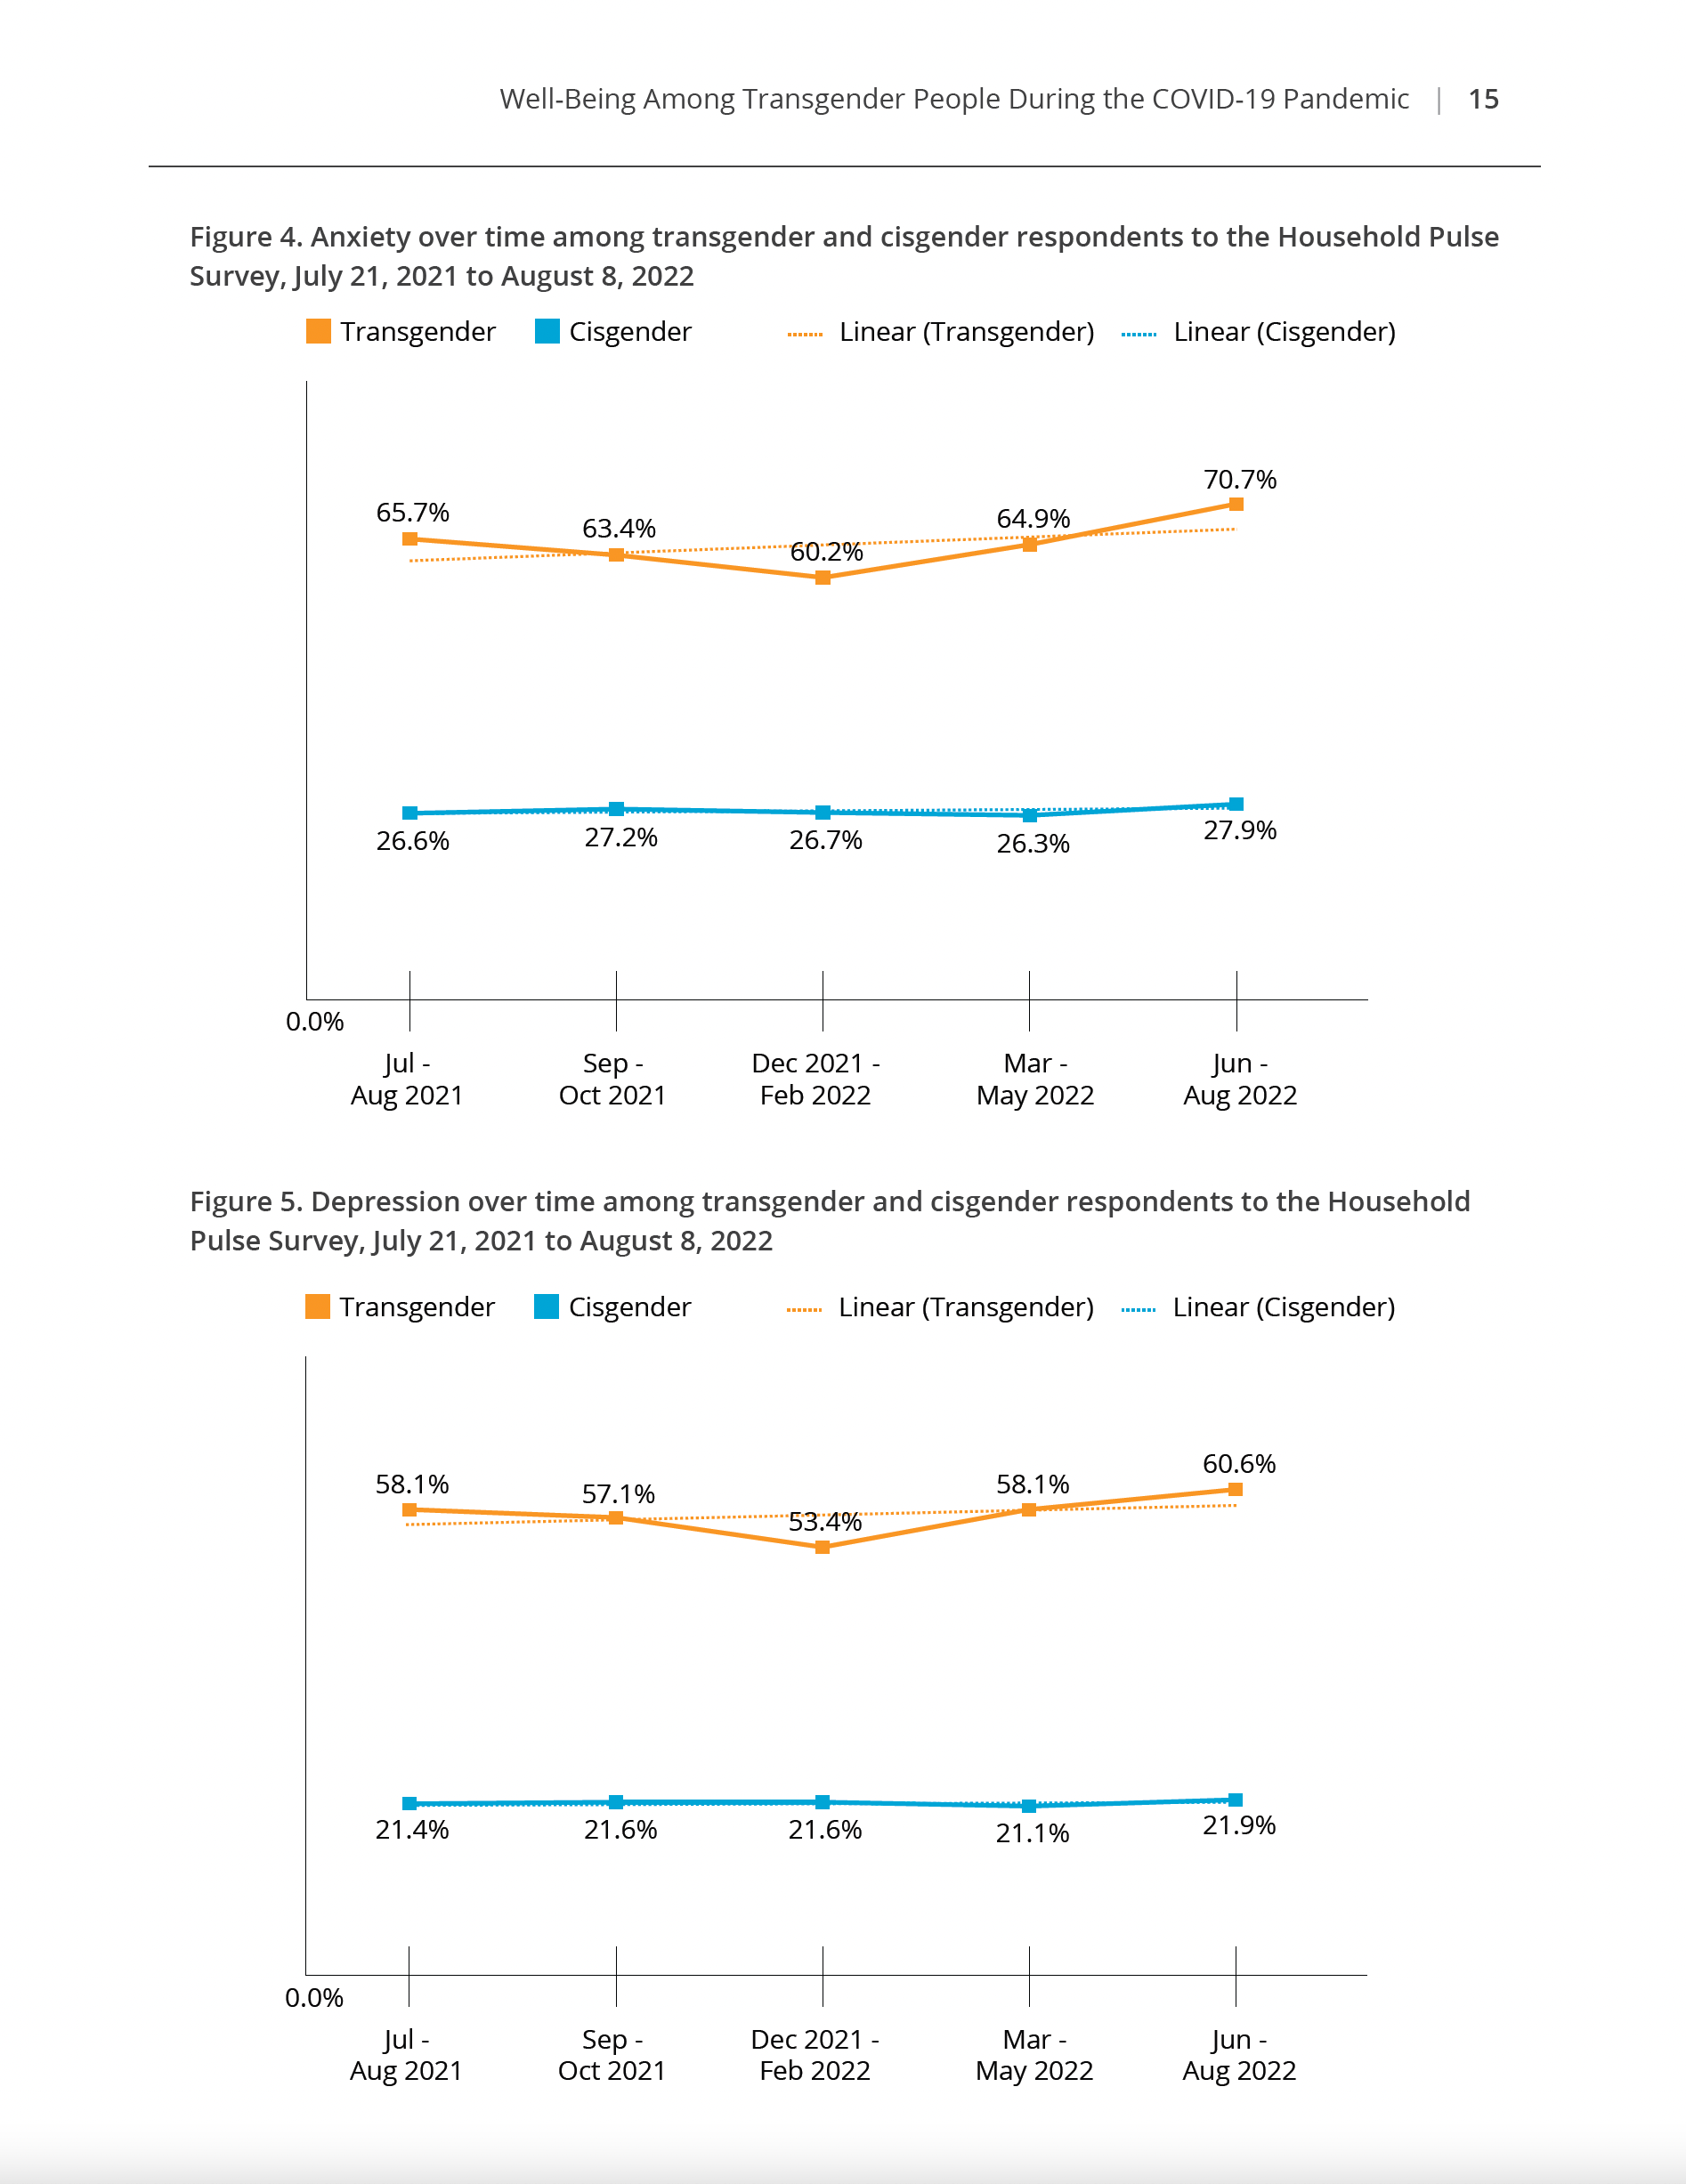
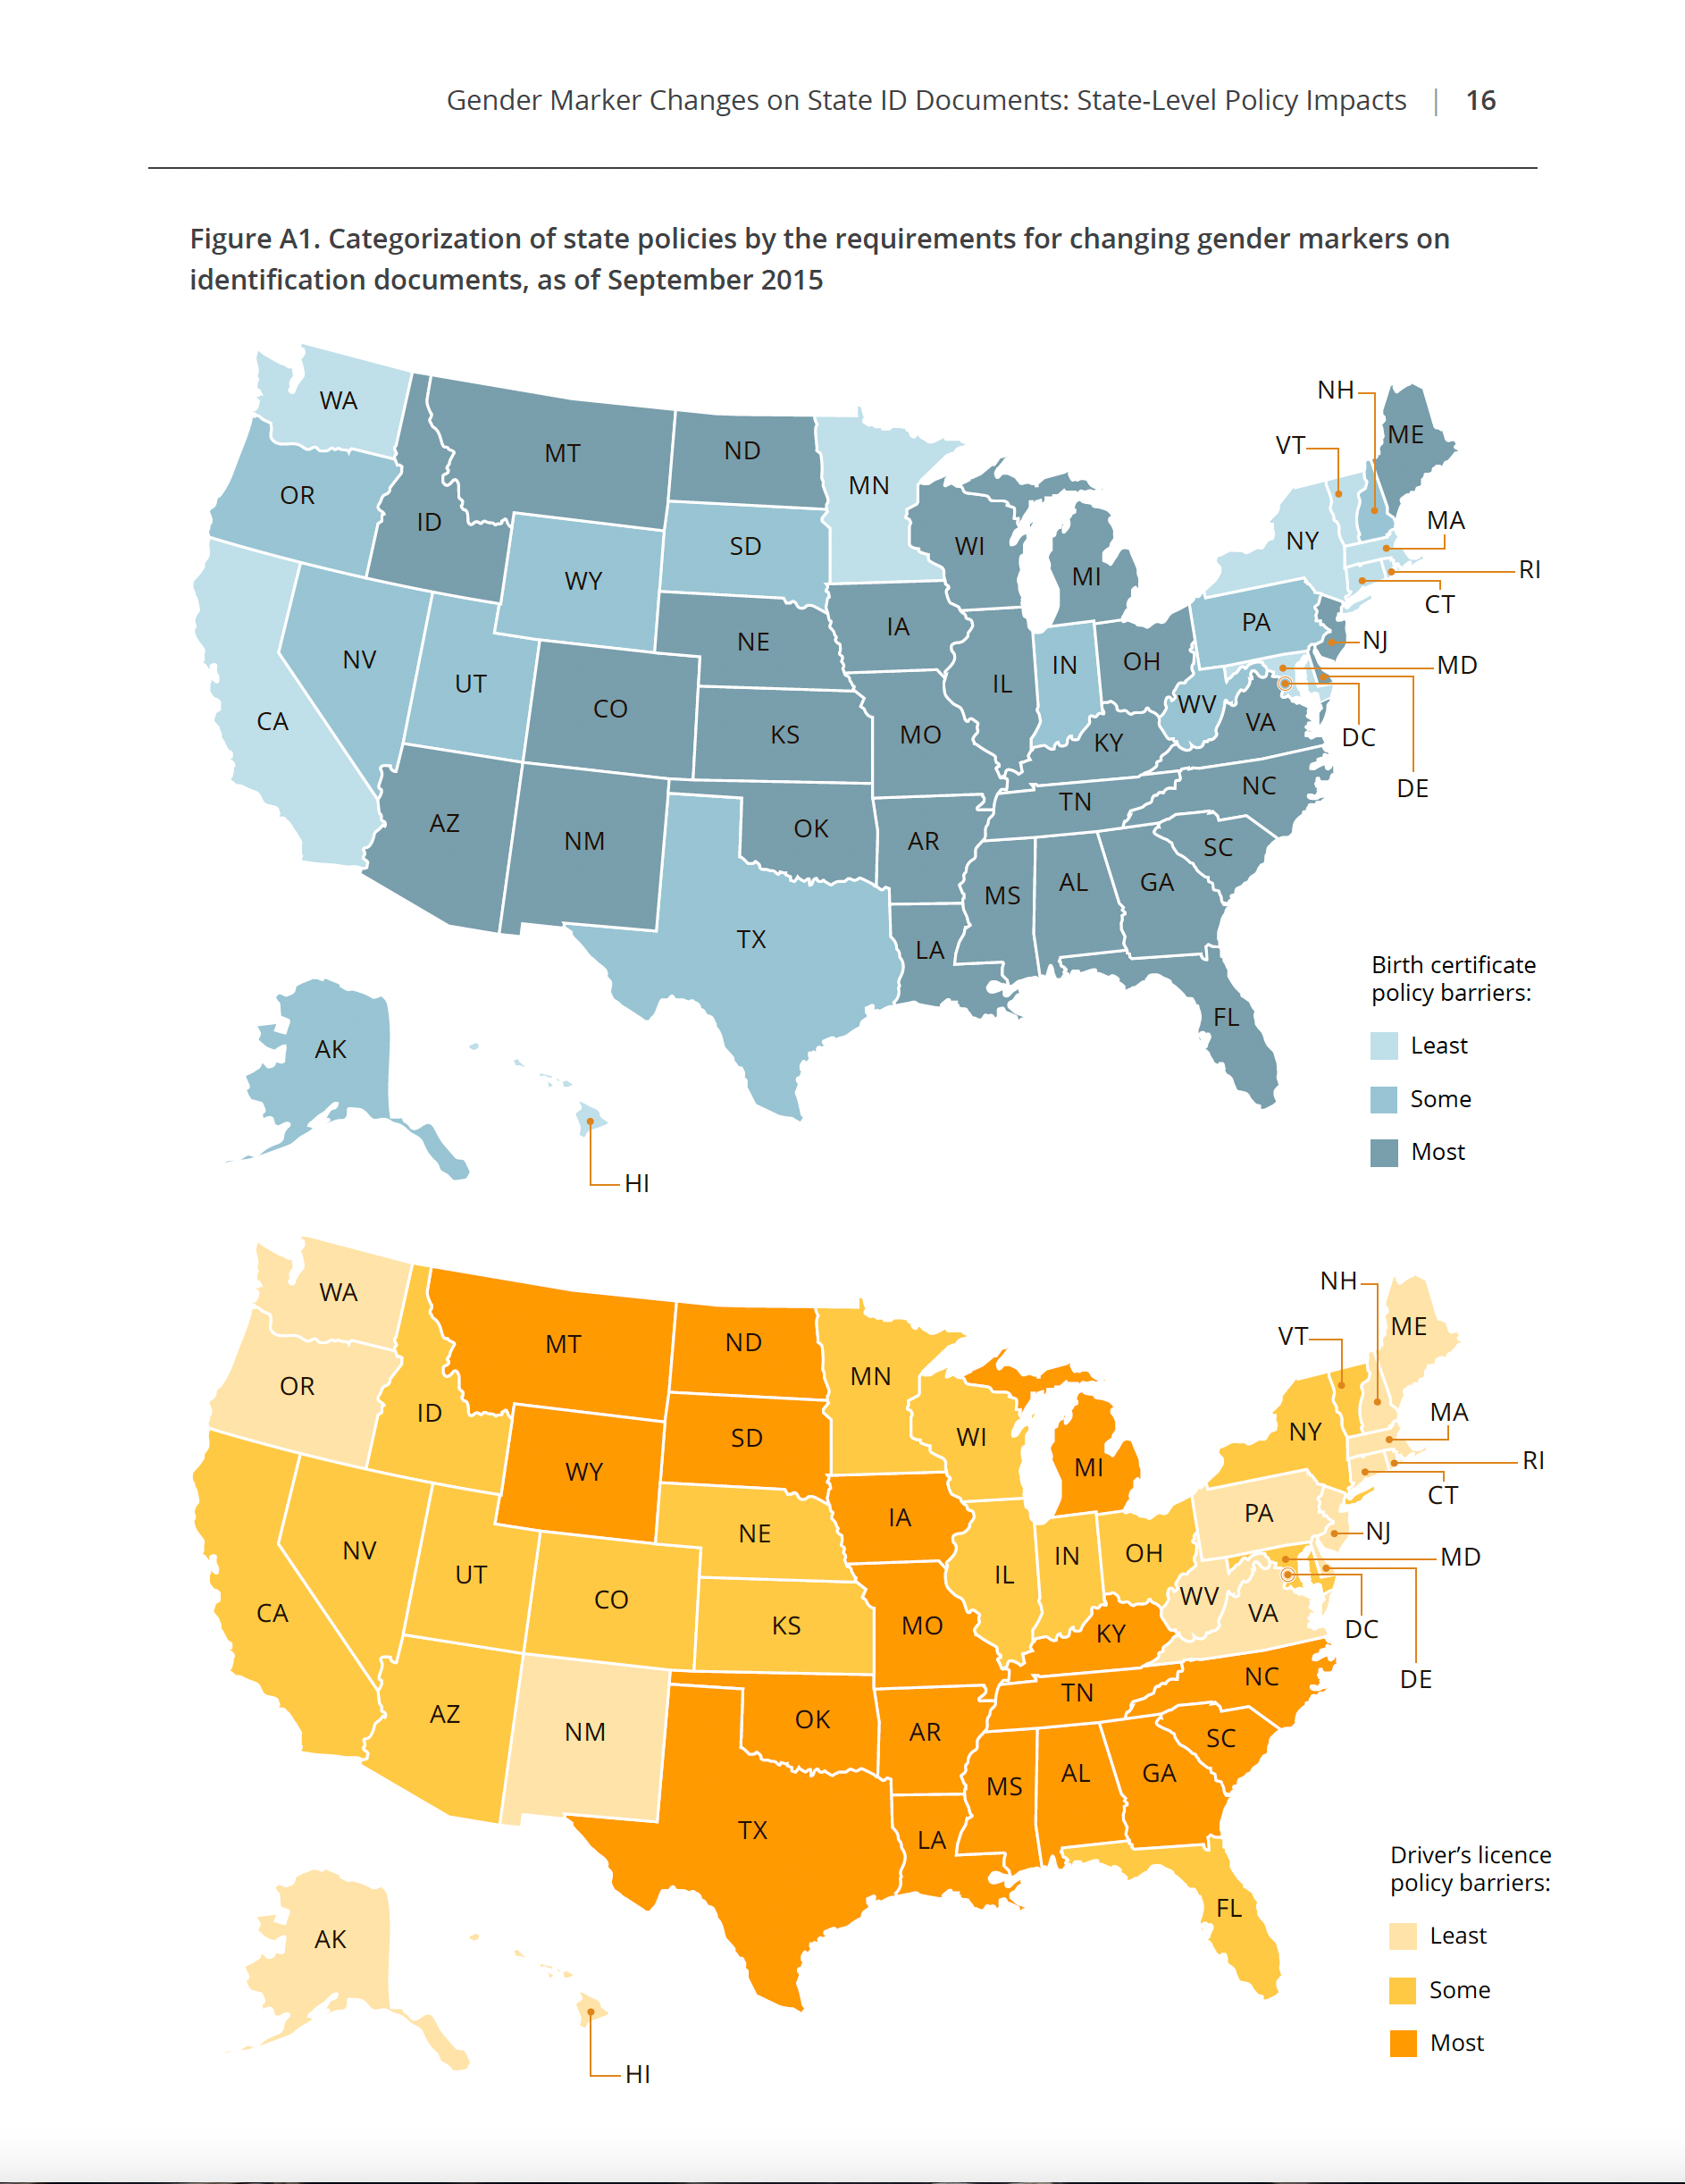
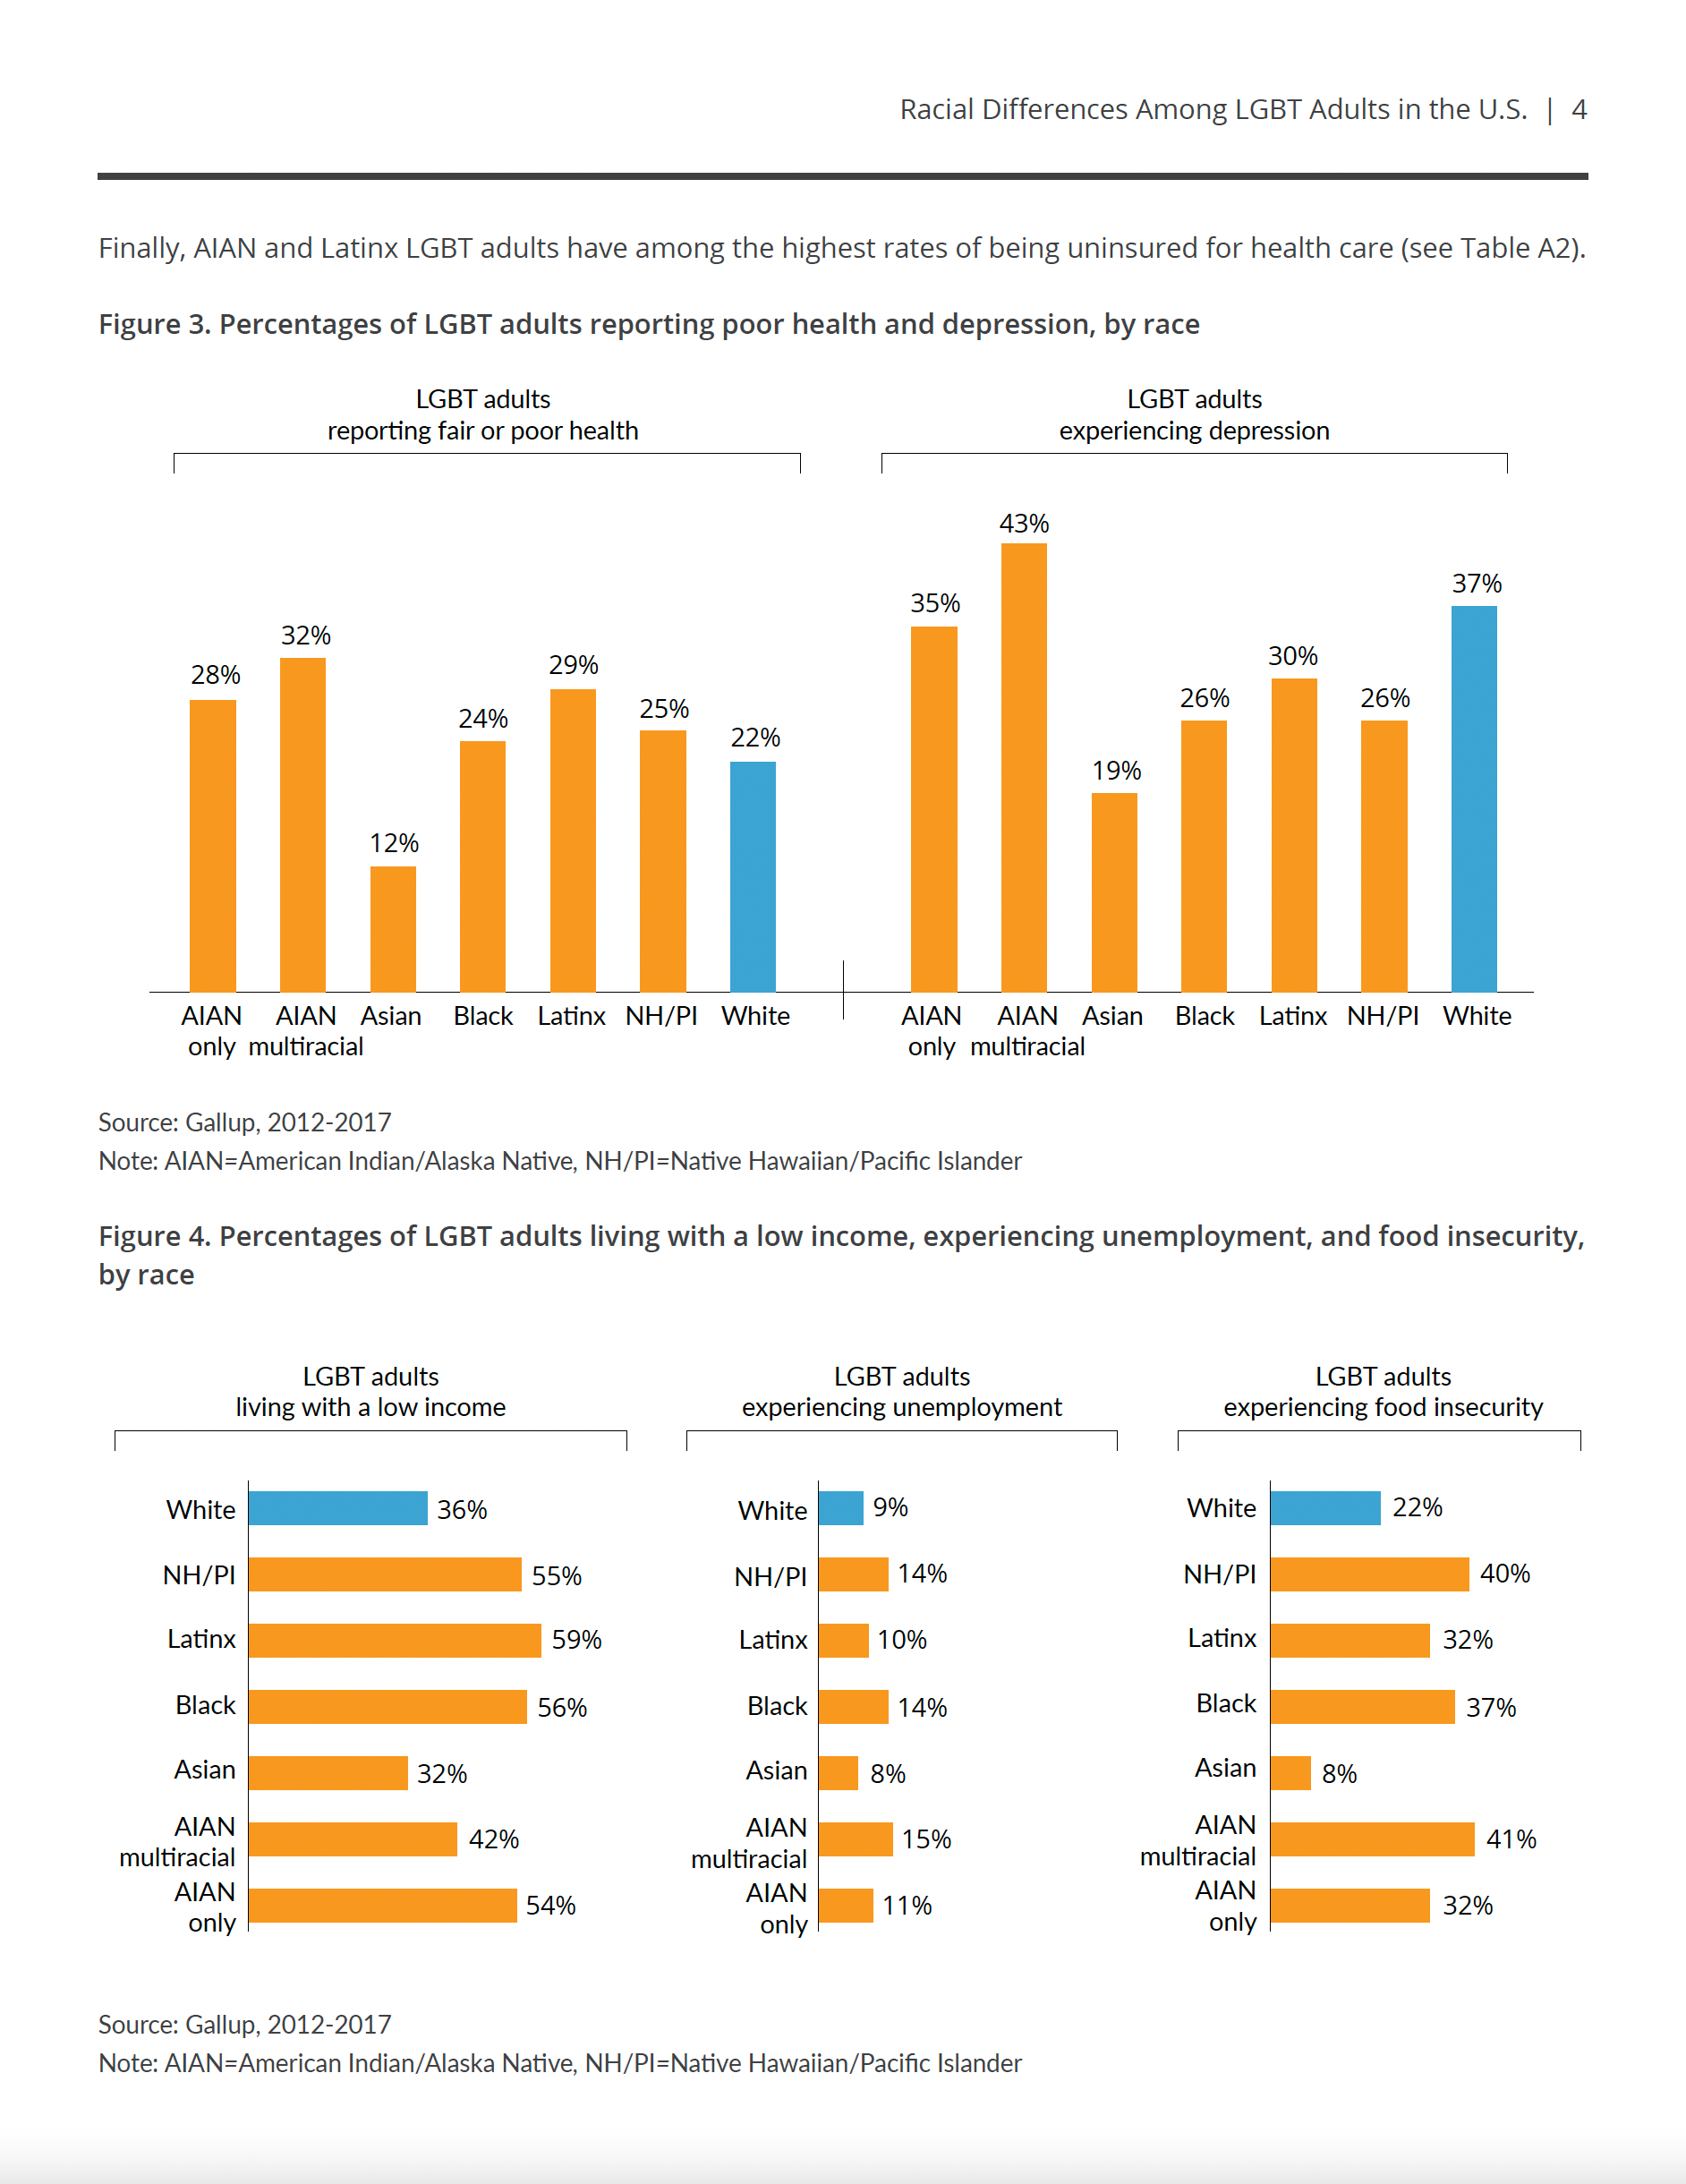
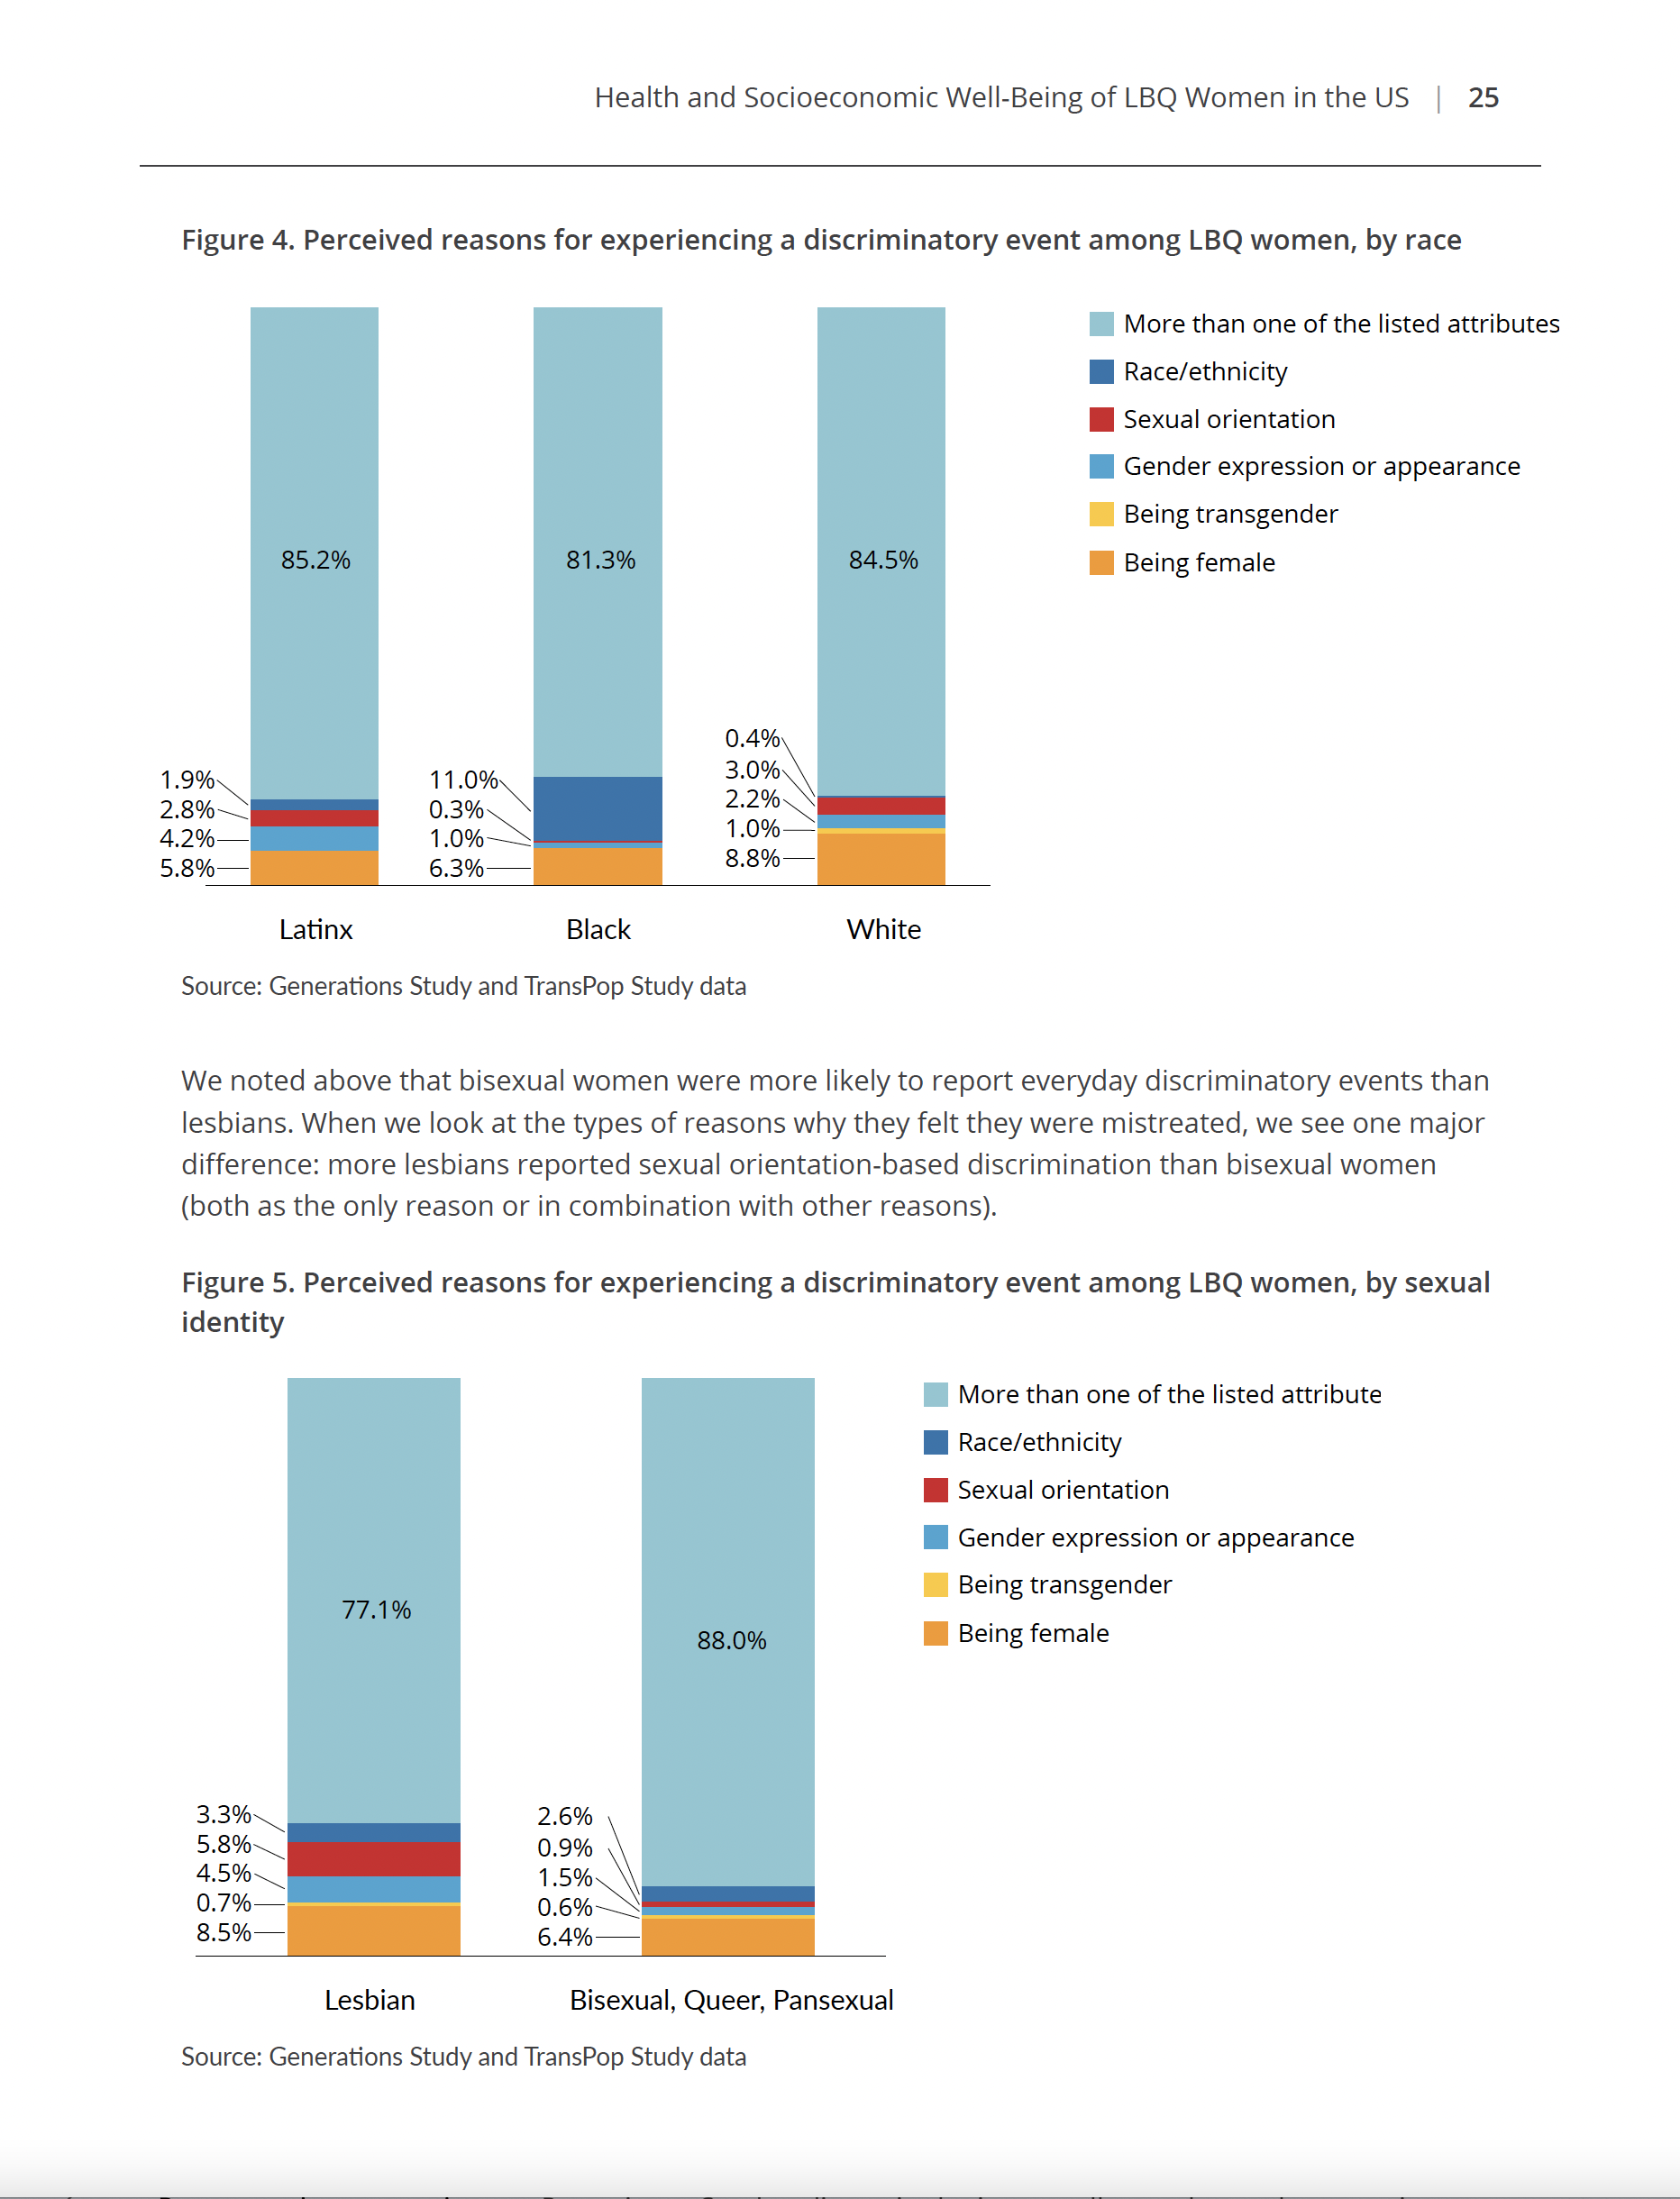
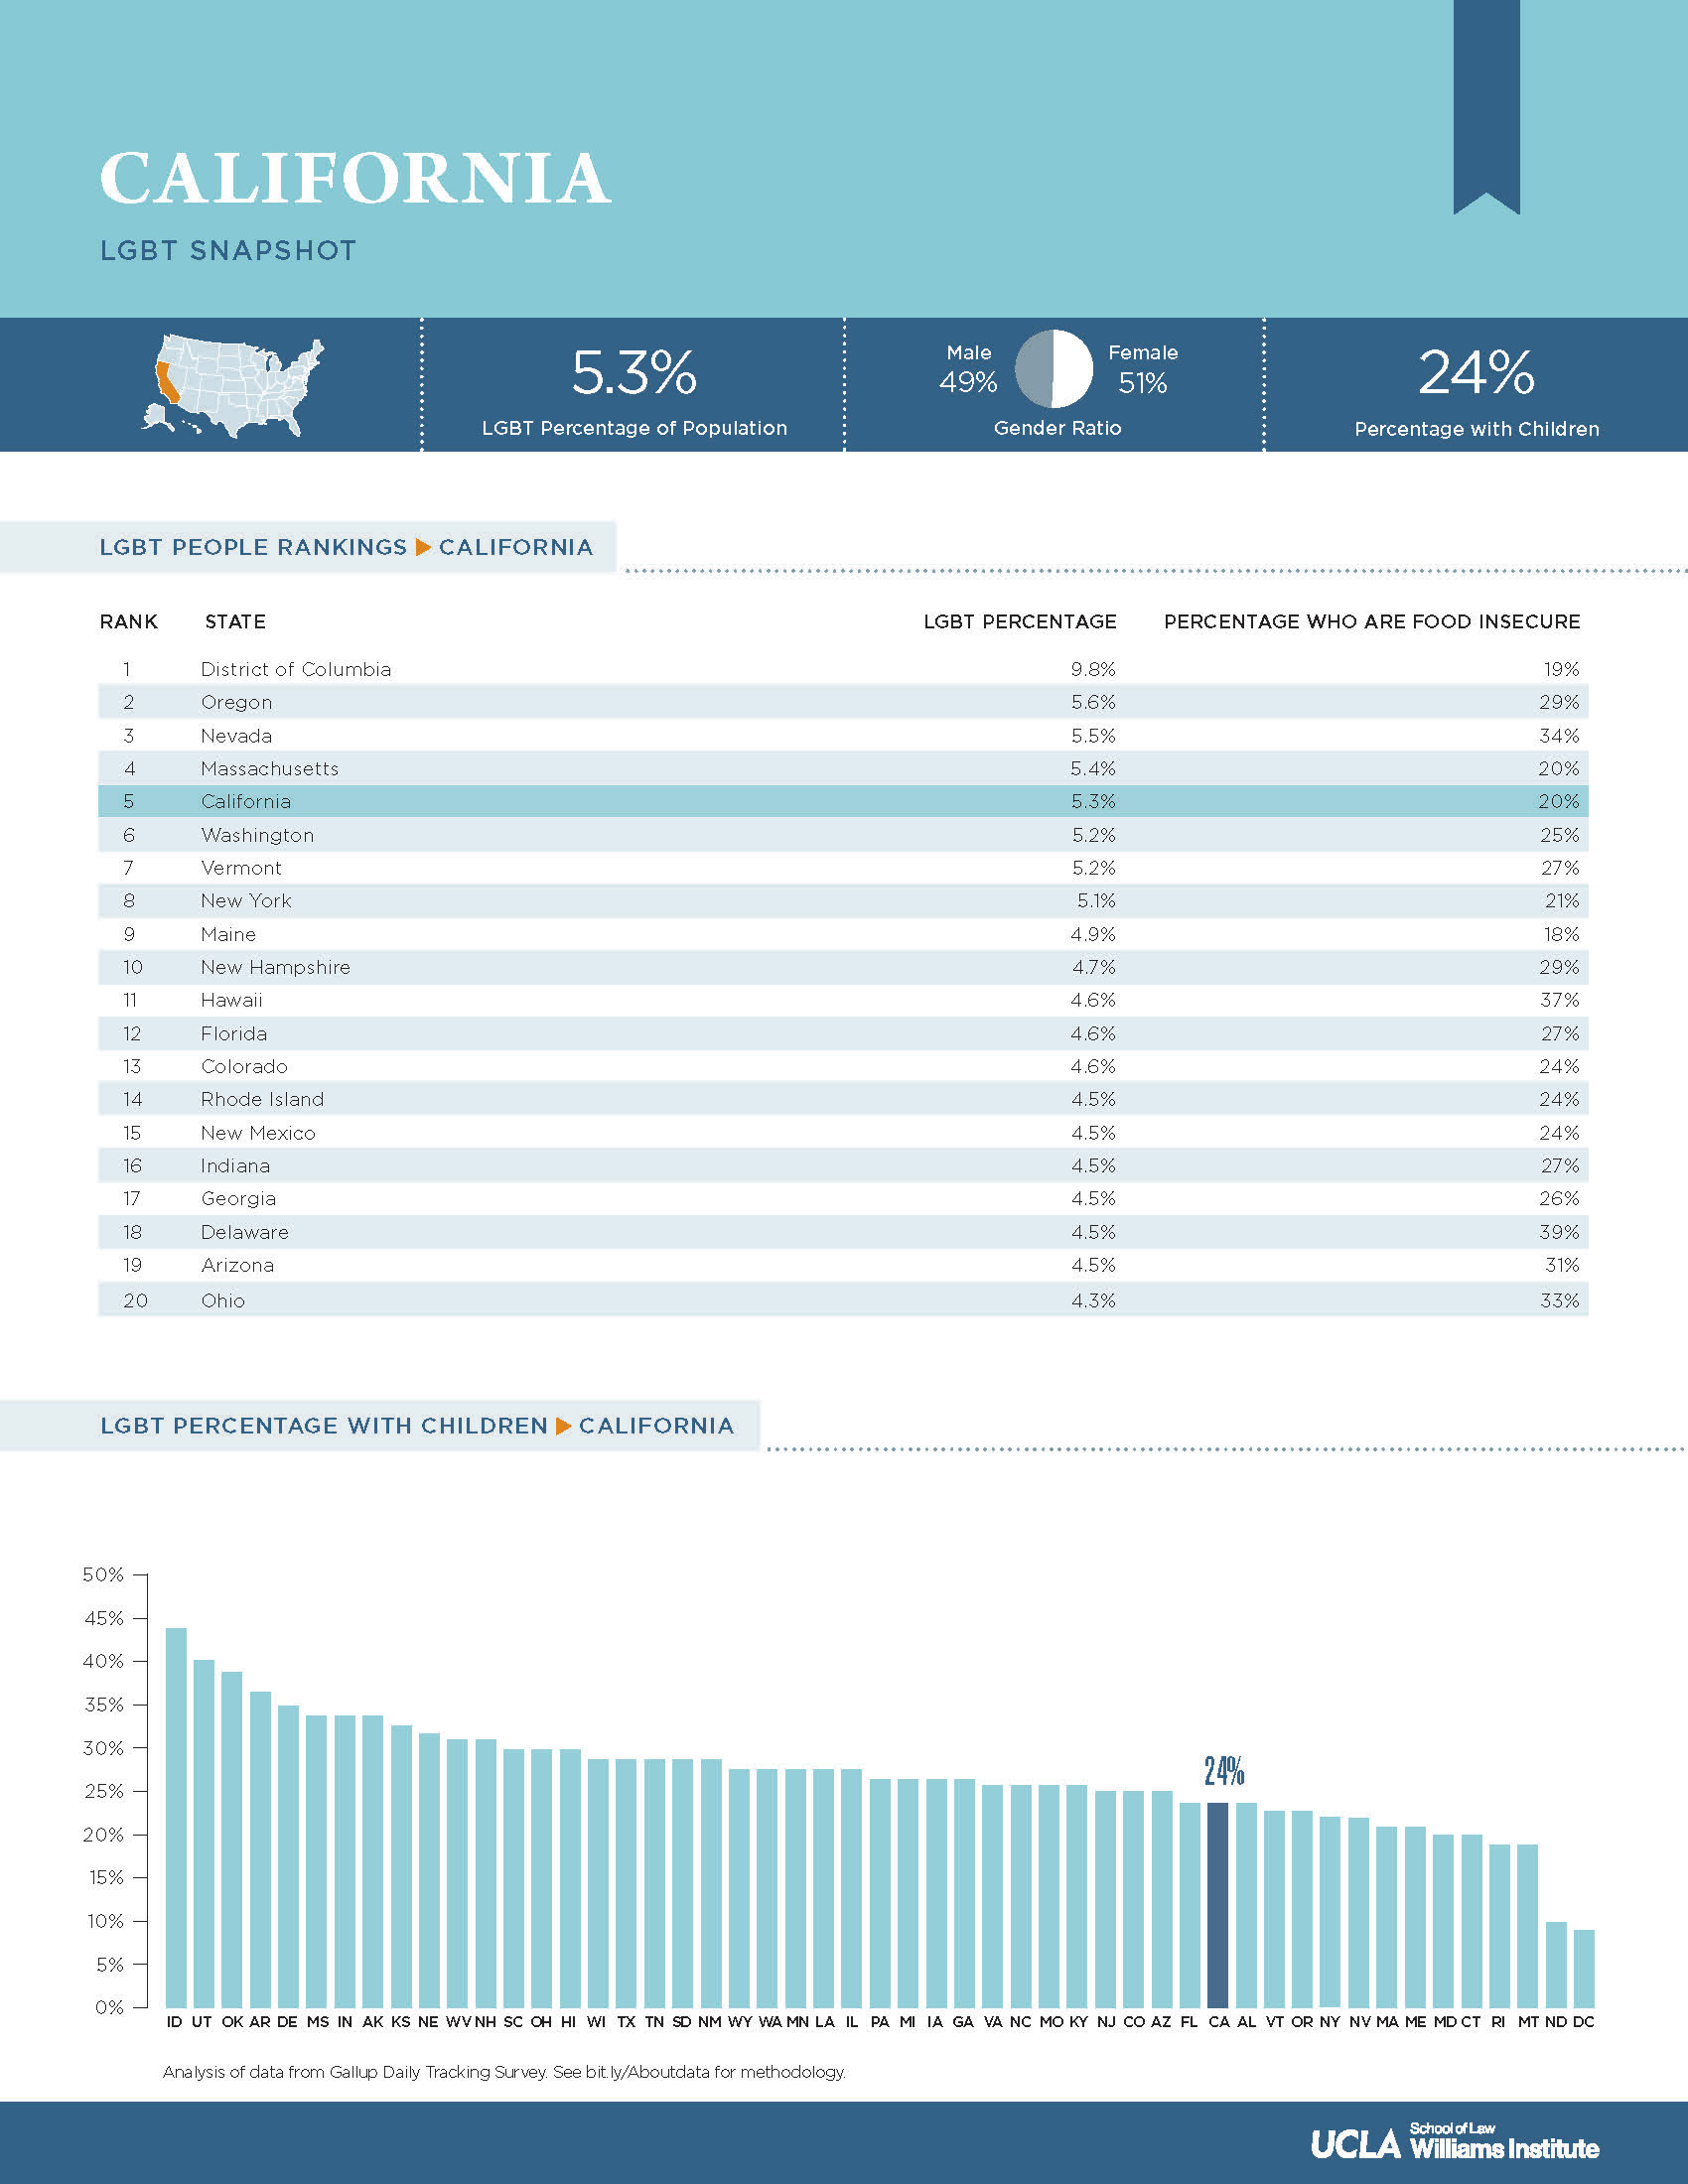
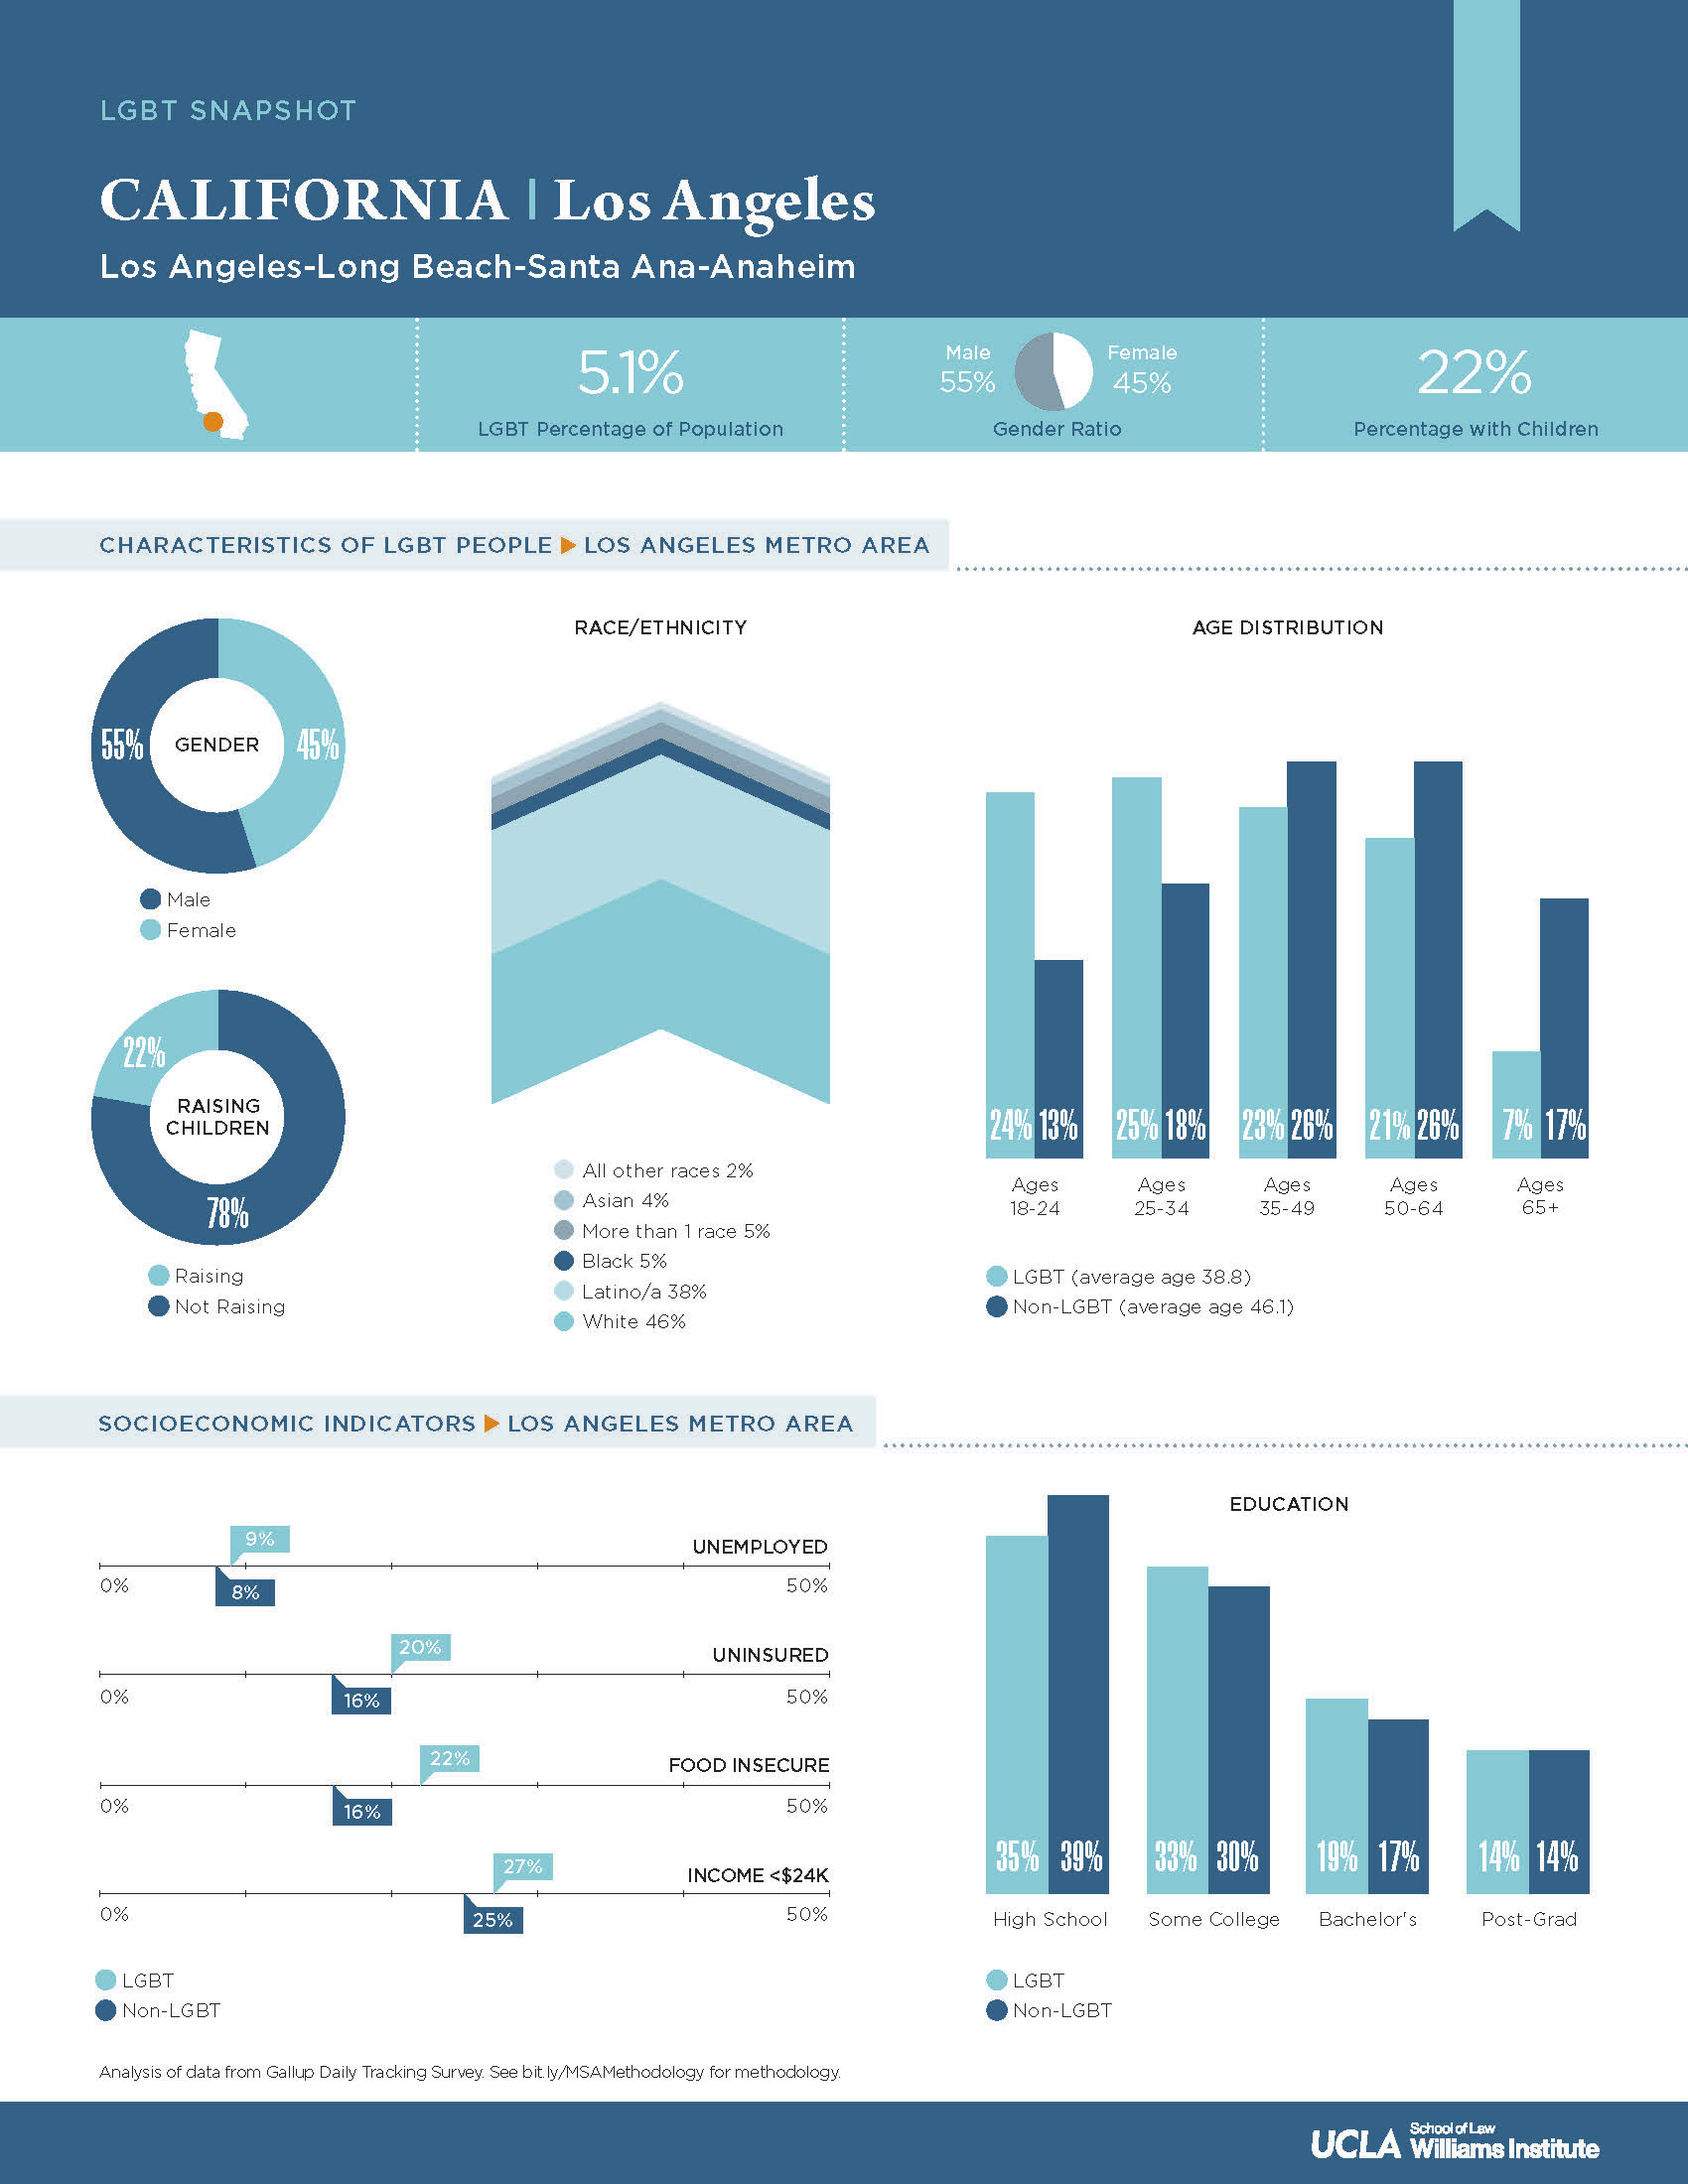
A selection of data visualization charts created for the institute publications.


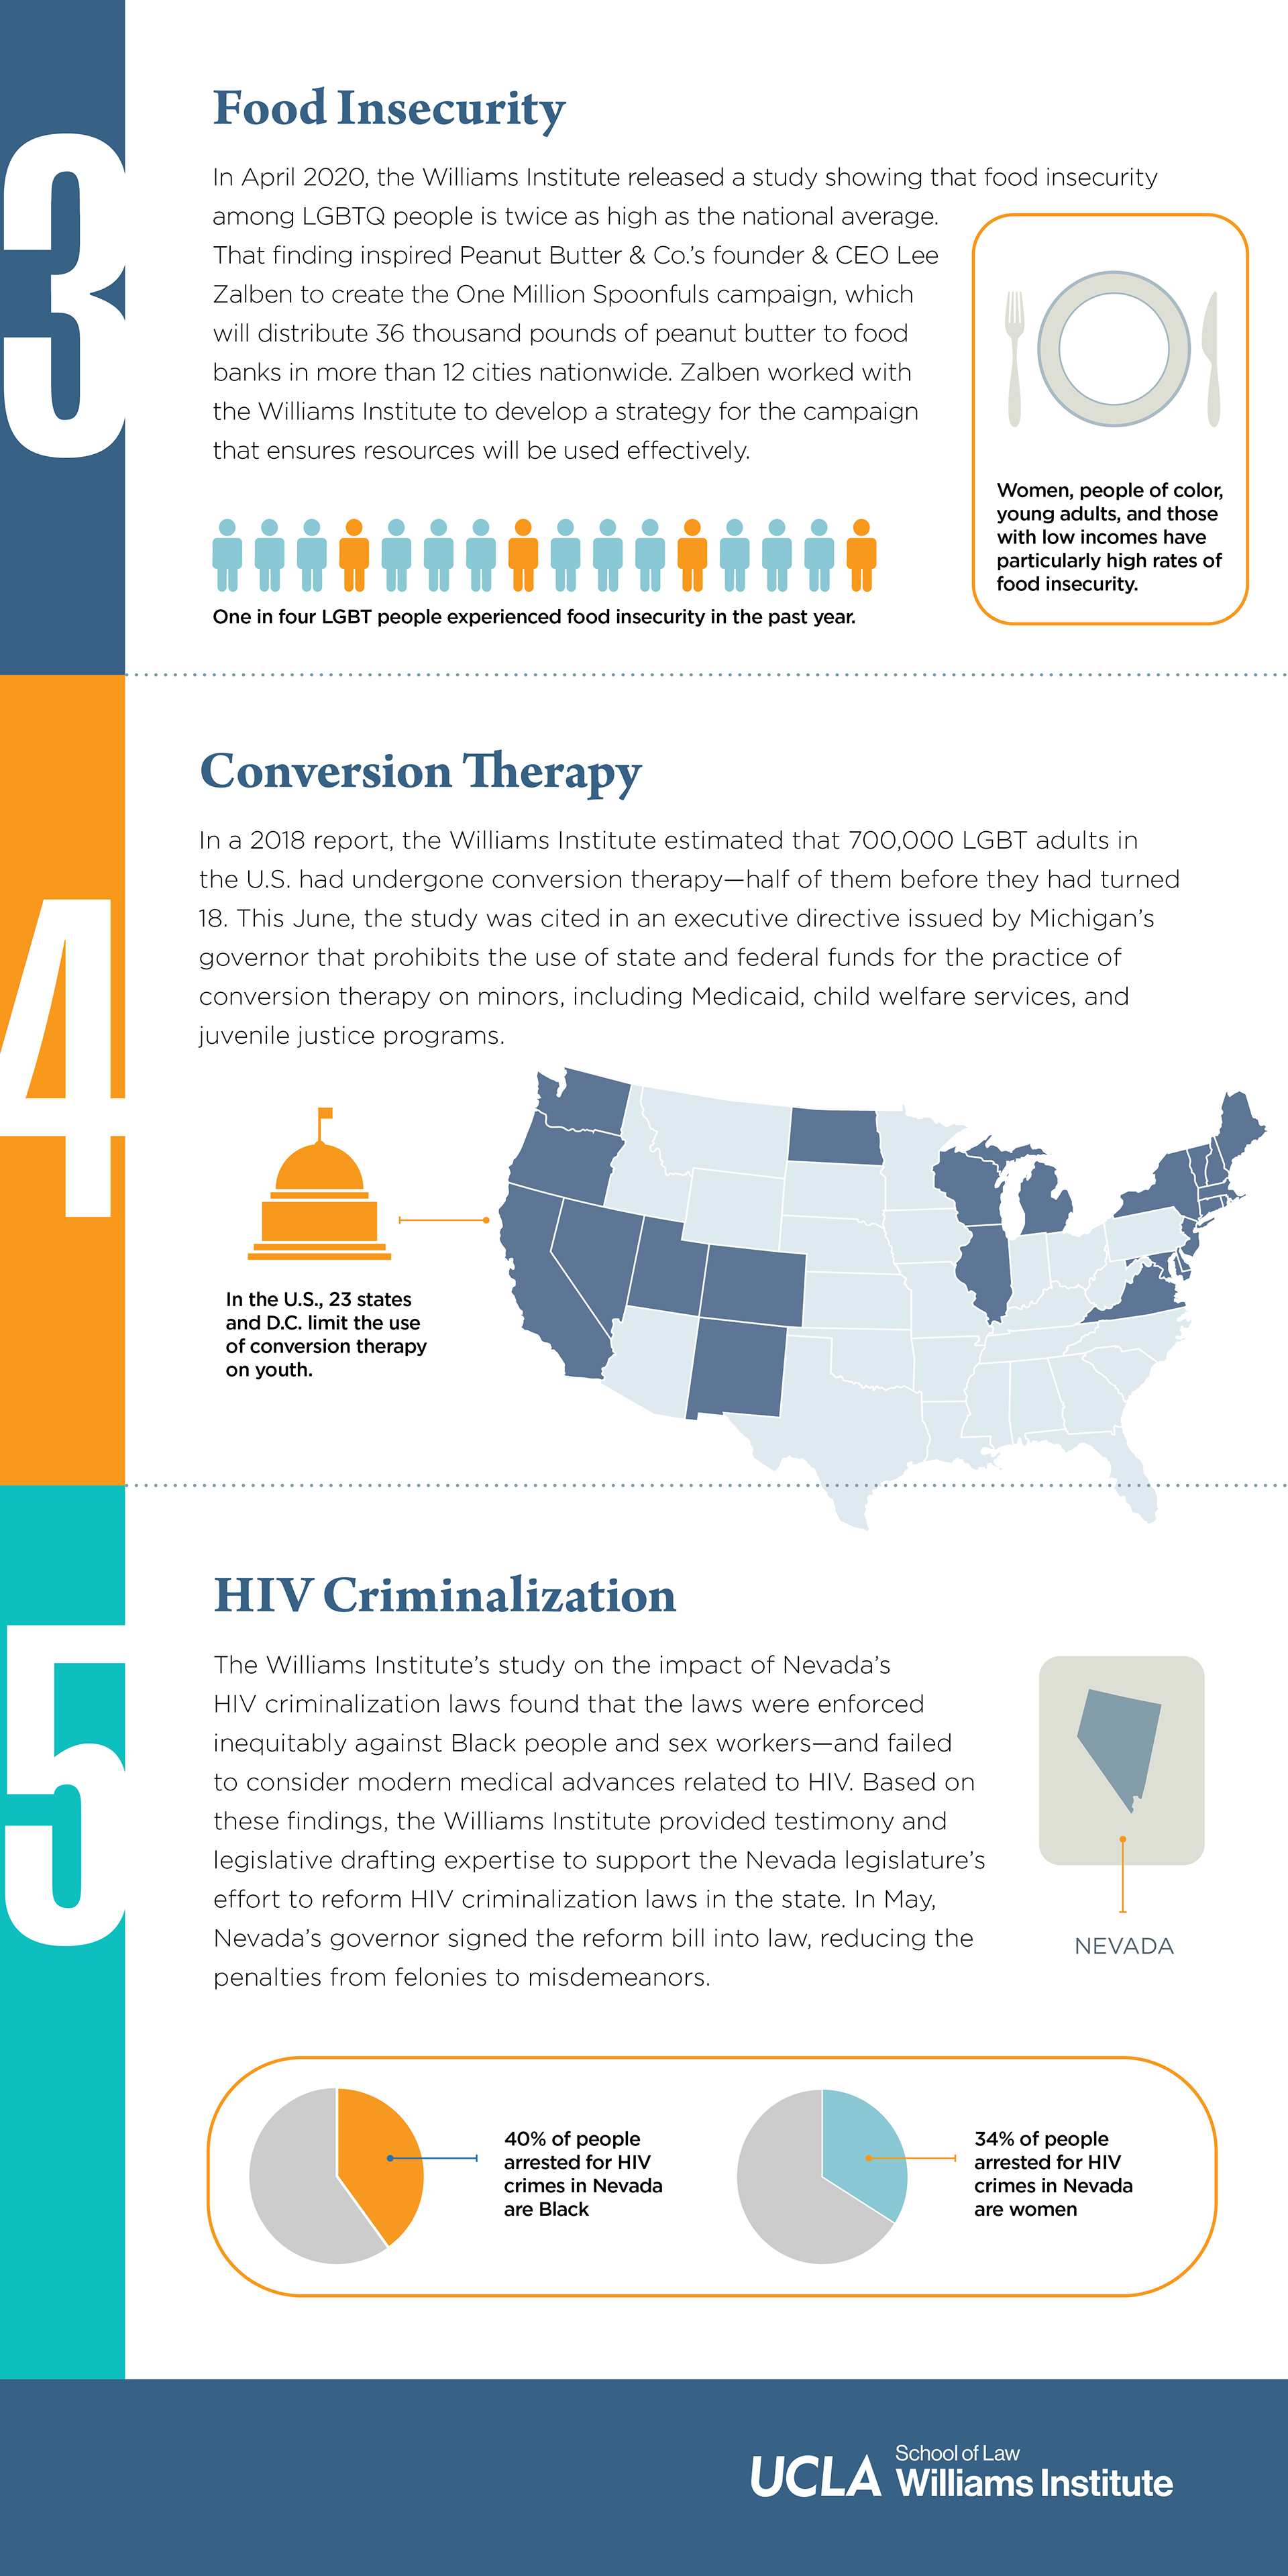
Data in Review
Graphic design for data visualization end of the year.
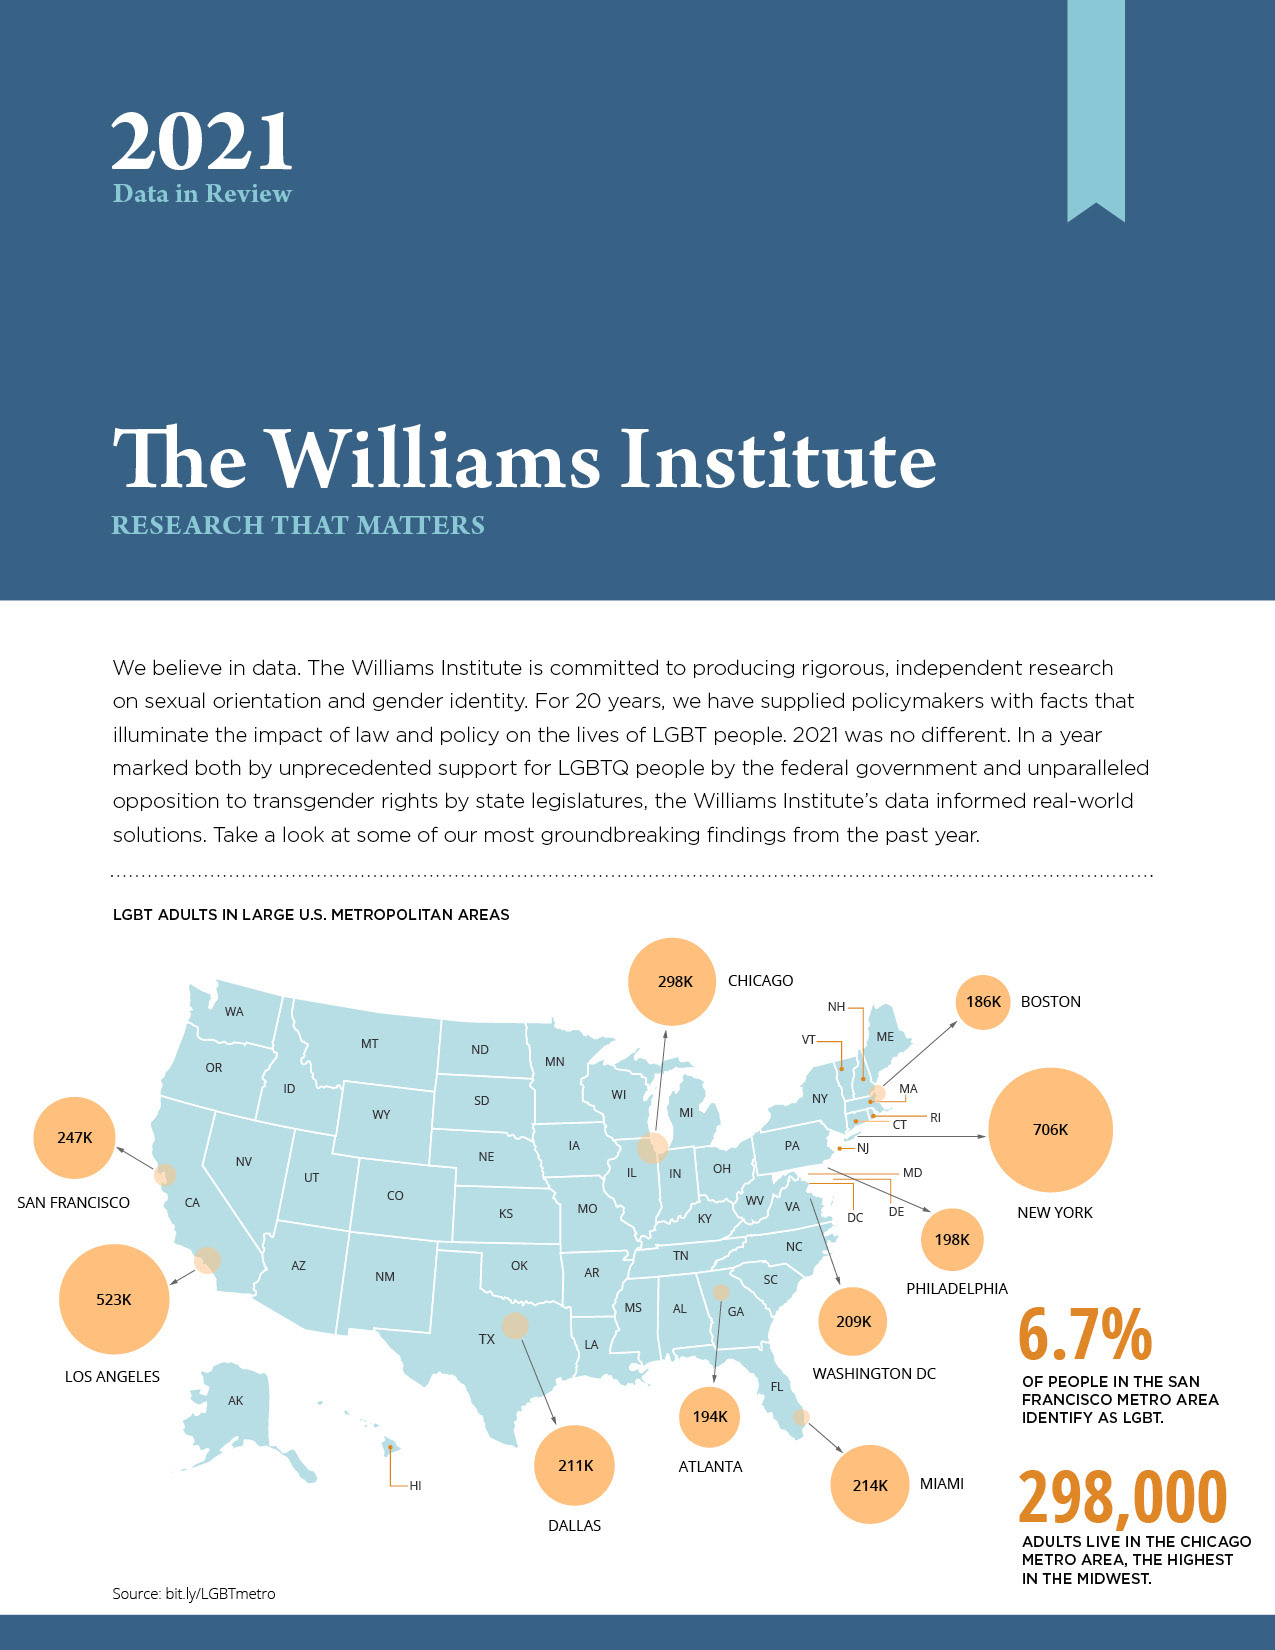

US Metropolitan Areas and States LGBT Snapshots
Sample of the graphic design and data visualization.


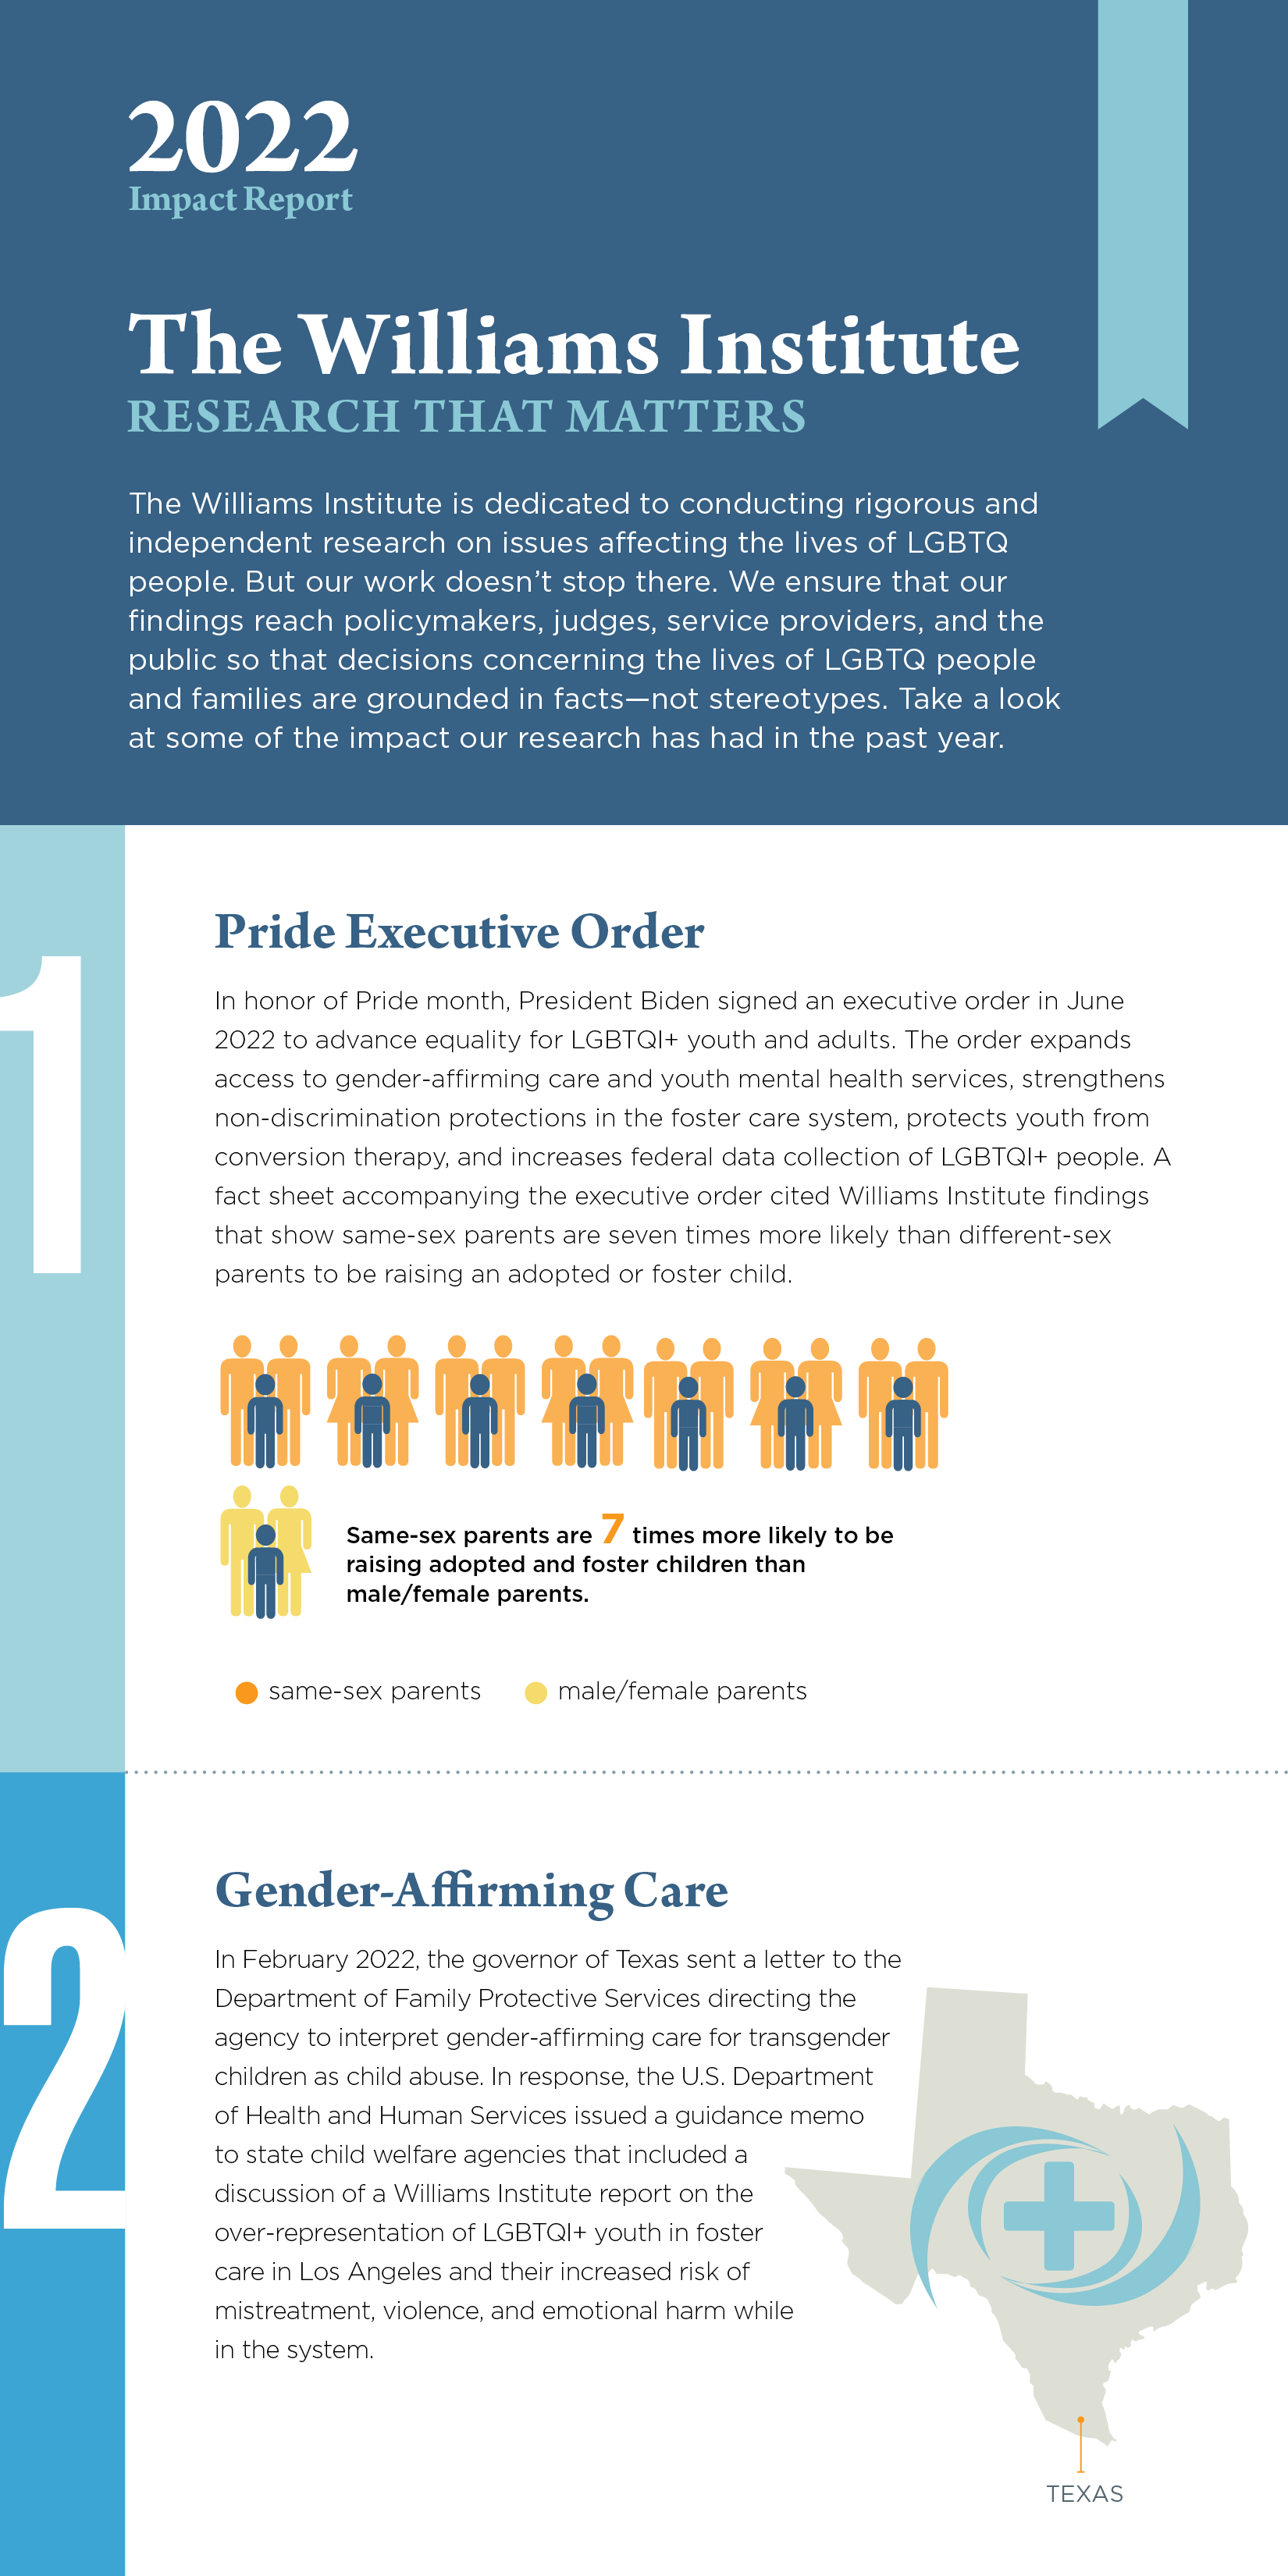
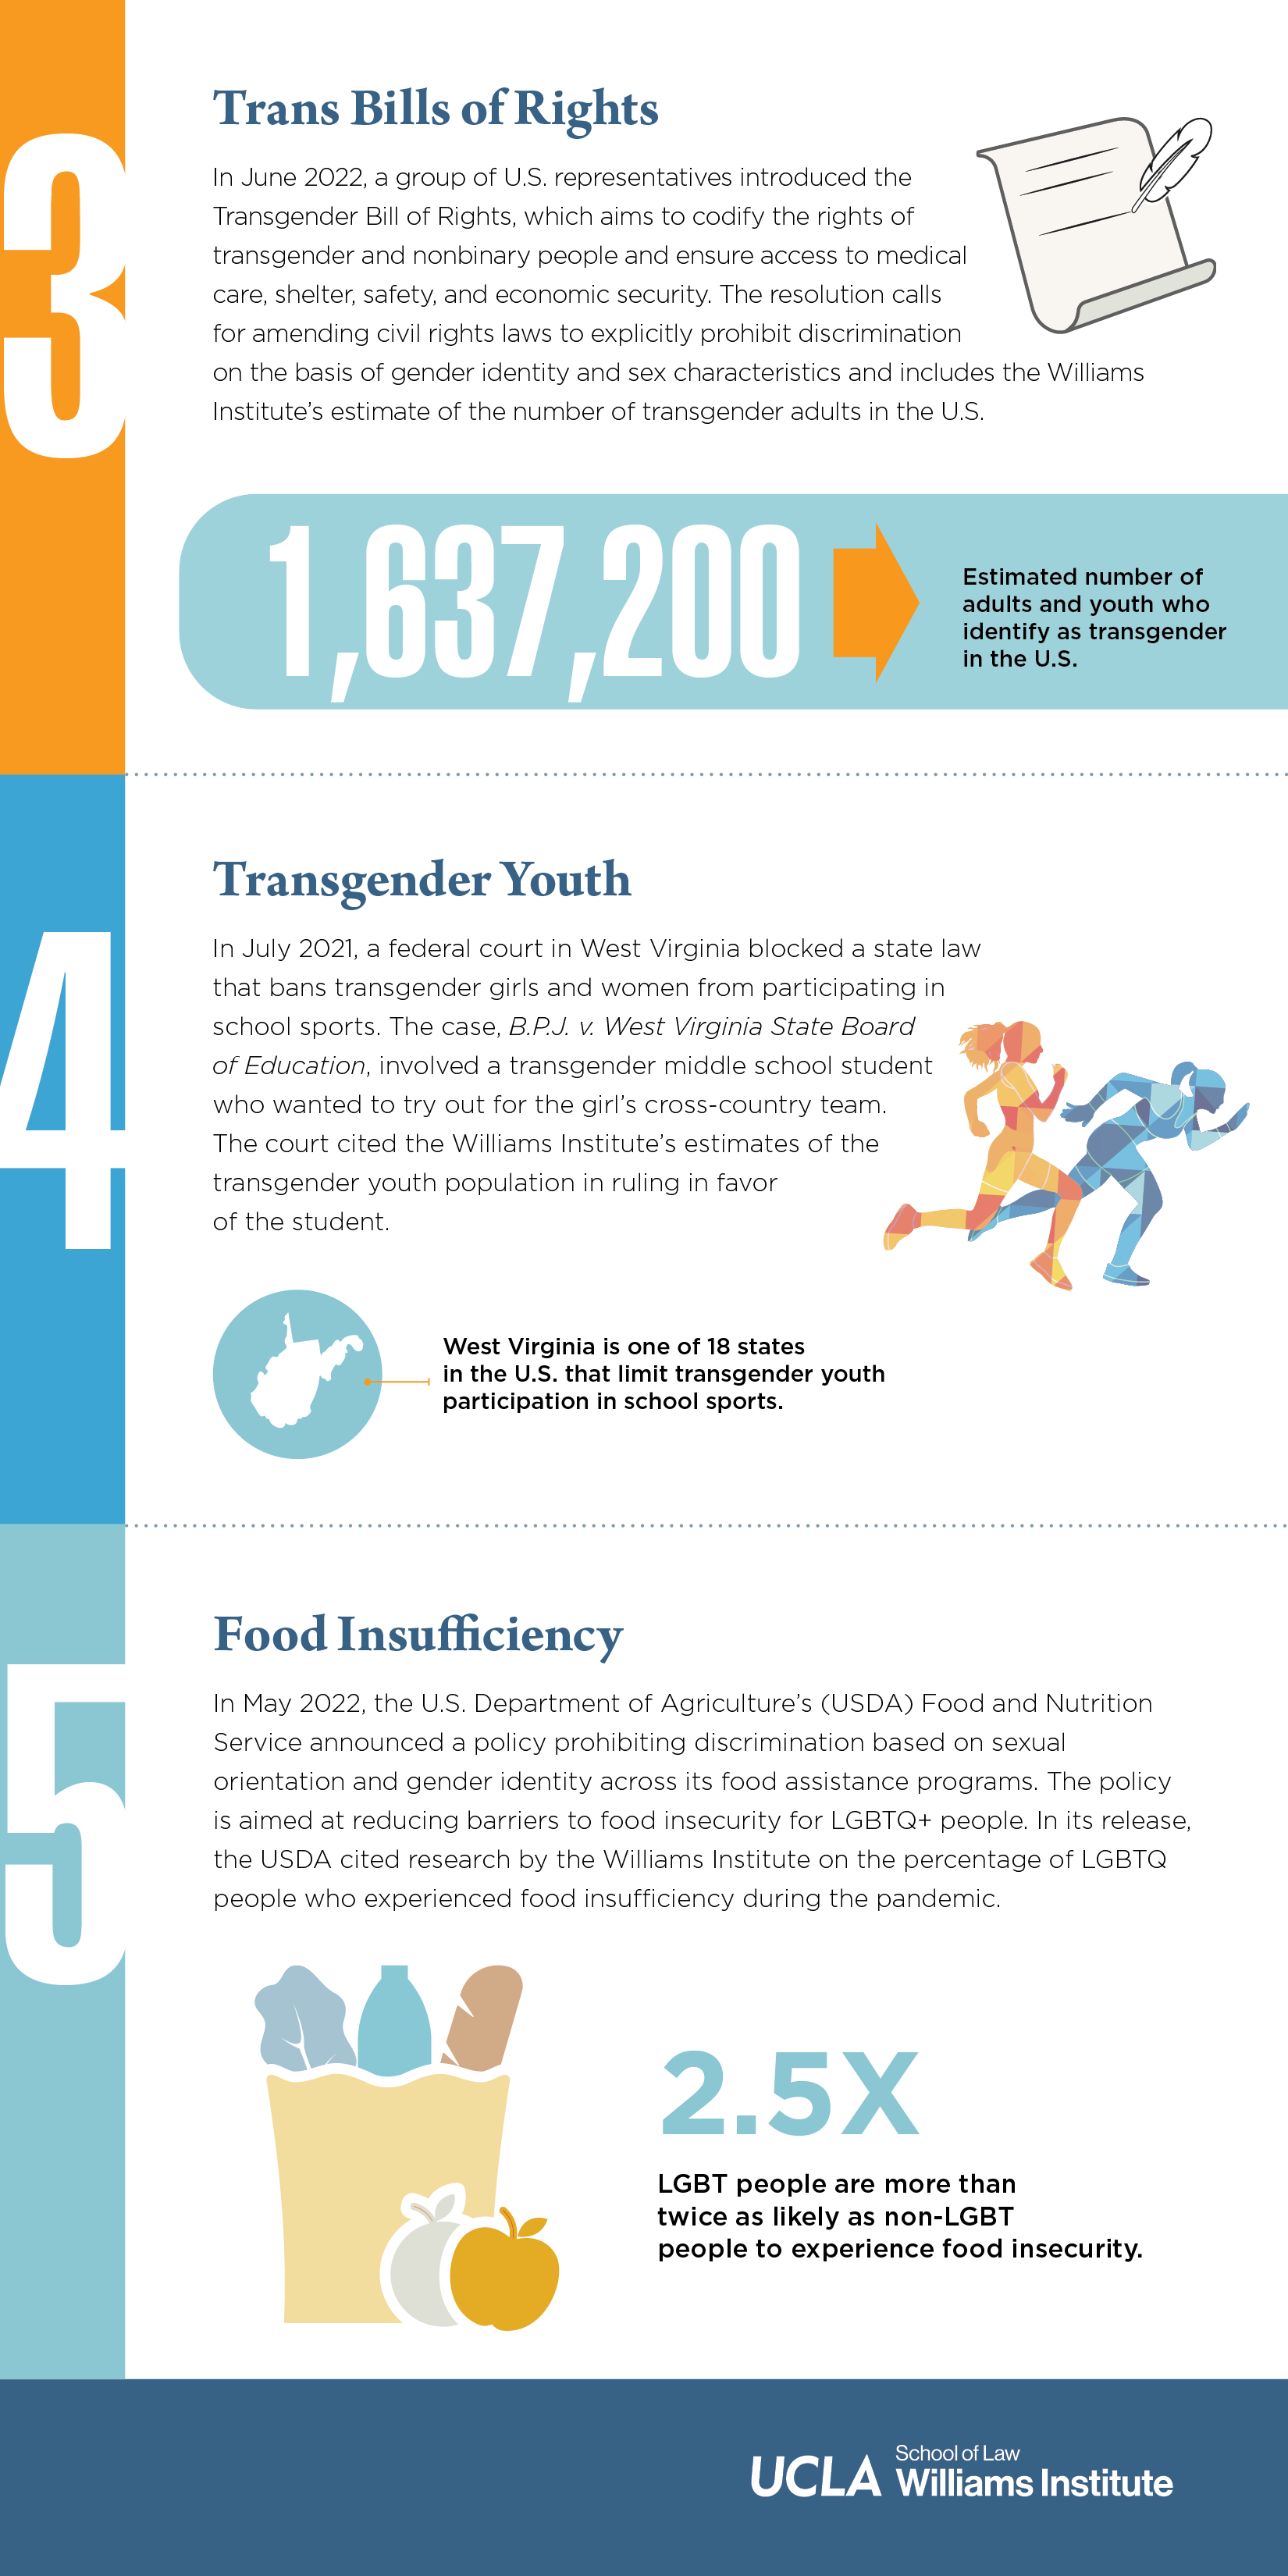
Impact Report
Graphic design for data visualization end of the fiscal year.

Ⓒ 2025 Sandro Del Rosario